Charpy V-notch testing remains widely used because it offers a standardized and efficient way to evaluate impact behavior in metallic materials. In production, qualification, and failure analysis work, it is often used to compare toughness response across temperatures, material conditions, and product forms.
The standard Charpy specimen measures 10 × 10 × 55 mm, but that geometry is not always available in practice. Thin sections, weld zones, heat-affected zones, and limited extraction volumes often make full-size specimens impractical. ISO 148-1 addresses this directly by permitting sub-size specimens when a standard specimen cannot be produced, including reduced-thickness options such as 7.5 mm, 5 mm, and 2.5 mm.
That change affects more than the recorded energy value. Reduced specimen size alters fracture constraint around the notch and can shift transition behavior, especially in ferritic steels. As a result, smaller-specimen Charpy data should be interpreted within its own testing context rather than read as a direct full-size equivalent.
This article examines how specimen size changes Charpy result interpretation, where comparison limits appear, and what engineers should verify before using reduced-size impact data in practical decisions.
What Specimen Size Effect Means in Charpy Testing
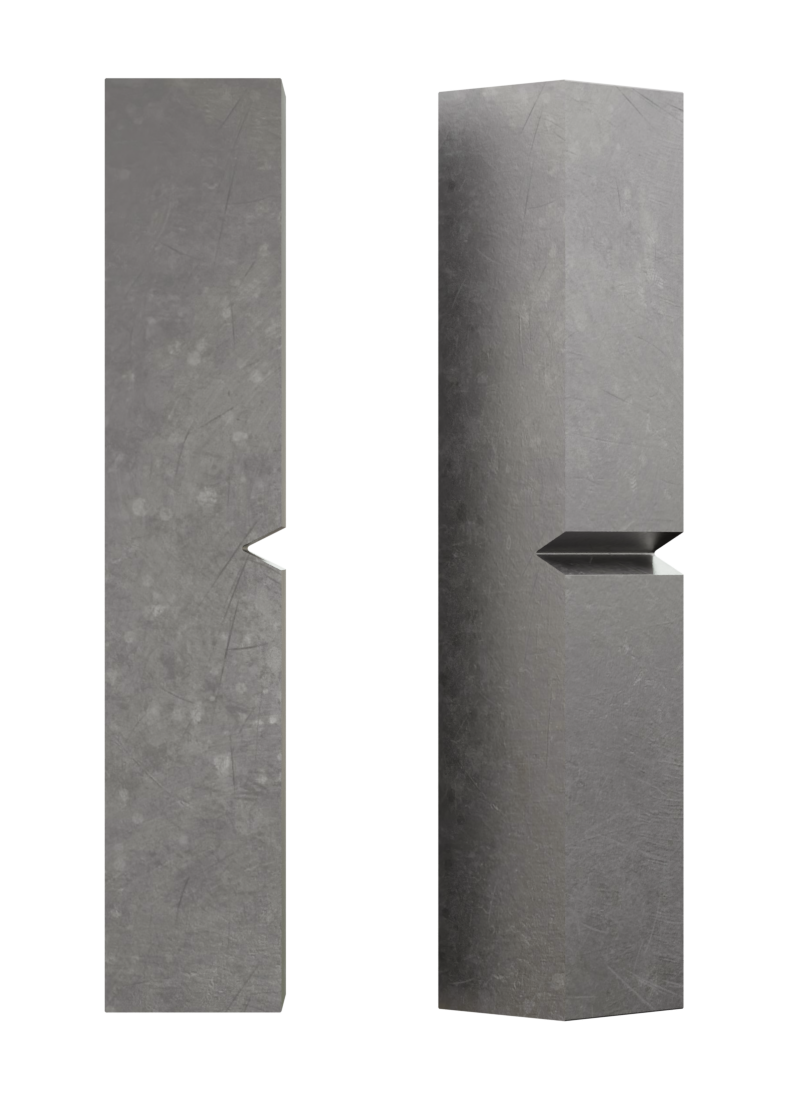 What counts as a specimen size effect in Charpy testing depends on more than a reduced cross-section. In practice, engineers are dealing with a combination of geometry, constraint, fracture response, and reporting basis. That is why reduced-size testing needs to be defined carefully before the results are compared or normalized.
A standard Charpy V-notch test piece is 55 × 10 × 10 mm. That geometry forms the baseline for most reference data, acceptance criteria, and transition-temperature discussions. ISO 148-1 also defines reduced-thickness sub-size variants for cases where a full-size test piece cannot be machined from the available material. The listed thicknesses are 7.5 mm, 5 mm, and 2.5 mm, while the nominal length and one 10 mm section dimension remain unchanged. The same general notch family is retained, and the specimen size must be reported when a non-standard geometry is used.
In North American technical practice, another reduced-thickness format appears regularly in research and correlation work: the 6.67 mm, or 2/3-size, format. This size is commonly included alongside 7.5 mm, 5 mm, and 2.5 mm sub-size variants when comparing sub-size behavior with full-size Charpy results.
At the standards level, these specimens are still part of the conventional Charpy framework. In practical interpretation, they should be treated as related specimen formats rather than interchangeable versions of the same test result. Once thickness changes, the fracture ligament changes with it, and that affects how the recorded impact response should be read.
Why Engineers Use Sub-Size Specimens
Sub-size Charpy specimens are usually used because the material does not allow full-size extraction. The most common cases involve thin plate, pipe, sheet products, weld metal, heat-affected zones, and other locations where the available section is too limited for a 10 mm specimen.
They are also relevant in in-service sampling, surveillance work, failure analysis, and development programs where only a small volume of material is available. In some cases, reduced-size test bars are used when full-size absorbed-energy levels approach the practical range of the test setup.
In other words, sub-size testing is often a practical requirement tied to the material being evaluated, not a preferred shortcut.
Why Smaller Specimens Do Not Produce Simple Scaled-Down Results
A reduced test piece leaves less material available to absorb impact energy, but the size effect does not stop there. Changing thickness also changes the stress state at the notch and reduces through-thickness constraint during fracture.
That effect is especially important in ferritic steels, where constraint influences the balance between ductile tearing and cleavage. As specimen size decreases, the measured response may shift not only in magnitude, but also in temperature dependence. This is why reduced-size Charpy data cannot be treated as a simple scaled-down version of a full-size result.
How Specimen Size Changes Measured Results
Once specimen size changes, the main outputs of Charpy testing do not move in the same way. Absorbed energy, upper shelf behavior, transition temperature, and complementary indicators such as lateral expansion can all respond differently depending on the material and the specimen format. Interpretation works better when it is based on the full response pattern rather than a single headline number.
Absorbed Energy
Absorbed energy is usually the first Charpy result engineers look at, but it is also the easiest one to overinterpret. When specimen thickness is reduced, the recorded energy drops. Part of that drop comes from the smaller fracture ligament. That relationship has led to widespread use of area-based normalization and simple proportional scaling in sub-size Charpy work. Those approaches can be useful for rough comparisons, but they are not universally reliable across materials, specimen sizes, or temperature ranges.
The main limitation is that absorbed energy is not governed by specimen geometry alone. It is also influenced by fracture mechanics, especially the stress state that develops at the notch during impact. In ferritic steels, reducing thickness changes through-thickness constraint, and that can alter the balance between ductile and brittle fracture mechanisms. Two test pieces cut from the same material and tested at the same temperature may therefore differ for reasons that go beyond reduced cross-sectional area.
The limitation becomes most visible in the transition region, where fracture mode changes rapidly with temperature. A sub-size value may track the full-size curve at one temperature and diverge at another. For that reason, reduced-size absorbed-energy values should only be treated as directly comparable when the material, fracture regime, and comparison method have been established for that case.
Upper Shelf Energy
Upper shelf energy often shows the clearest size effect in Charpy testing. As specimen size decreases, upper shelf energy usually falls sharply, and the trend can be much stronger than a casual normalization approach would suggest. This pattern is well documented in line-pipe steels and other ferritic materials.
A strong example comes from X70 line-pipe steel. In one reported dataset, upper shelf energy changed as follows across specimen families:
- 419.8 J for the full-size bar
- 252.1 J for the 2/3-size bar
- 128.9 J for the 1/2-size bar
- 47.1 J for the RHS miniature format
- 10.0 J for the KLST miniature format
That progression shows how quickly the measured upper shelf response can contract as specimen size is reduced, particularly when the comparison extends beyond ordinary sub-size formats into miniaturized Charpy geometries. It also helps explain why a single conversion factor rarely captures the full behavior of a material family across multiple specimen sizes.
Evidence from recent plate-steel work points in the same direction. In one high-strength steel study, different normalization methods produced very different interpretations of what a reduced-thickness result meant in full-size terms. Area-scaled full-size equivalent upper shelf energy fell substantially as thickness decreased, while volume-scaled full-size equivalent values were much less sensitive. For one 2H50 plate example, the measured 10 mm upper shelf energy was about 270 J; the area-scaled equivalent at 2.5 mm was about 114 J, while the volume-scaled equivalent at the same thickness was about 230 J. That gap is large enough to change how a result would be interpreted in practice.
Upper shelf energy is highly size-sensitive, and the chosen normalization method can materially change the interpretation. Comparison works best when the method matches both the material class and the purpose of the evaluation, rather than relying on one rule across all cases.
Ductile-To-Brittle Transition Temperature
Ductile-to-brittle transition temperature is one of the most important outputs derived from Charpy testing in ferritic steels. In many engineering decisions, the transition curve matters more than any single energy value because it shows how impact response changes across the temperature range where fracture mode is shifting.
As specimen thickness decreases, the apparent transition temperature often shifts to lower values. The main reason is reduced through-thickness constraint. With less constraint, cleavage becomes less strongly favored, and the specimen can remain in a more ductile response regime at lower temperatures than a full-size specimen from the same material. This effect is most relevant in BCC ferritic steels, where transition behavior is a central design and qualification concern.
The X70 line-pipe dataset provides a clear numerical example. Using absorbed-energy-based transition metrics, the reported DBTT values shifted as specimen size decreased:
- −94.5 °C for the full-size bar
- −100.3 °C for the 2/3-size bar
- −103.8 °C for the 1/2-size bar
- −126.6 °C for the RHS miniature format
- −136.6 °C for the KLST miniature format
A lower transition temperature from a smaller specimen does not automatically indicate higher service toughness. It reflects a change in measured transition behavior under a different geometry and constraint condition. For that reason, DBTT comparisons are stronger when they are made curve-to-curve, with a clearly defined transition criterion and explicit specimen-size reporting.
Very small sub-size specimens add another complication. At 2.5 mm thickness, some datasets show reduced temperature sensitivity, which weakens standard transition-curve interpretation and makes full-size equivalence harder to justify.
Lateral Expansion And Fracture Appearance
Absorbed energy is only part of the Charpy picture. Lateral expansion and shear fracture appearance can add important context, especially near the transition region where a single energy value may not fully describe how the specimen failed. Standards already reflect that broader view by including definitions and reporting approaches for these measures alongside absorbed energy.
Lateral expansion helps show how much plastic deformation developed before fracture. Fracture appearance, including the proportion of shear area, helps indicate whether the response was predominantly ductile, predominantly brittle, or mixed. When specimen size changes, those indicators can help explain why two absorbed-energy values that seem close may still represent different fracture behavior.
Near DBTT, absorbed energy can change rapidly over a narrow temperature interval, while lateral expansion and fracture appearance may show the fracture-mode shift more clearly. Using these indicators together produces a more reliable interpretation than relying on absorbed energy alone.

Why Direct Comparison Between Full-Size And Sub-Size Results Can Be Misleading
Direct comparison between full-size and reduced-size Charpy results can be misleading even when both tests are performed correctly. The reason is simple: once specimen size changes, the test is no longer sampling exactly the same fracture conditions. Geometry, material response, and fracture regime all start to influence how far one result can be carried into another.
Geometry Changes The Stress State
A smaller Charpy bar does more than reduce the fractured section. It also changes the stress state at the notch. As thickness decreases, through-thickness constraint and local stress triaxiality decrease, which can alter fracture development during impact loading. In ferritic steels, this often shifts the balance away from cleavage and toward more stable ductile deformation at the same temperature.
That is why a lower absorbed-energy value from a sub-size test piece cannot be explained by reduced ligament area alone. In the transition region, geometry can influence both the position and the shape of the transition curve. Full-size and sub-size results should therefore be treated as related measurements generated under different constraint conditions, not as directly scaled equivalents.
Different Materials Do Not Respond The Same Way
Size effects are not uniform across material classes. In BCC ferritic steels, specimen size often has a strong connection to ductile-to-brittle transition behavior, which is why DBTT shifts appear so often in sub-size Charpy studies. Reduced constraint in smaller specimens can move the apparent transition temperature downward and alter the way the impact curve should be interpreted.
That logic does not transfer cleanly to FCC materials. Austenitic stainless steels and other FCC alloys do not exhibit ductile-to-brittle transition behavior in the same way ferritic steels do, so the meaning of a specimen size effect is different from the start. In those materials, absorbed-energy normalization may still matter, but transition-temperature shift is usually not the central issue.
Material toughness level matters as well. Historical and modern studies show that low-shelf materials, quenched-and-tempered steels, and high-strength plate steels do not respond identically as specimen size decreases. In some lower-ductility cases, energy reduction tracks section loss more closely. In tougher steels, transition-range behavior often changes more visibly. At 2.5 mm thickness, some plate-steel datasets also show weak temperature sensitivity, which further limits straightforward comparison.
Correlations Exist, But They Are Conditional
Correlation methods between full-size and sub-size Charpy results do exist, but they are conditional rather than universal. Their reliability depends on material class, specimen size, temperature range, and fracture regime.
This is where simple conversion tables become risky. Agreement is limited unless the compared specimens represent the same brittle, transition, or ductile regime. Once that alignment is lost, a single factor no longer preserves the meaning of the result.
A more defensible approach is to compare fitted curves rather than isolated values. Instead of forcing one specimen size into another through a fixed multiplier, engineers can compare corresponding points on the full-size and sub-size curves at the same temperature. In many cases, conversion is better treated as a curve-mapping problem than as a one-step correction.
Sub-Size Vs. Miniaturized Charpy Specimens: Not The Same Thing
Reduced-size Charpy data is often discussed as though it belongs to one category. In practice, that is not accurate. Sub-size specimens and miniaturized formats are related, but they are not the same specimen family, they are not covered by the same standards in the same way, and they should not be interpreted on the same basis.
What Counts As Sub-Size
Sub-size Charpy test pieces stay within the conventional Charpy framework. The general specimen family remains the same as the standard 55 × 10 × 10 mm format, while thickness is reduced to fit the available material section. Under ISO 148-1, the explicitly listed sub-size thicknesses are 7.5 mm, 5 mm, and 2.5 mm. In North American practice and technical literature, 6.67 mm, or 2/3-size, variants also appear regularly in sub-size comparison work.
The key feature is that these test pieces remain reduced-thickness versions of the conventional Charpy geometry. Length stays at 55 mm, one 10 mm section dimension is retained, and the notch family follows the same general full-size test logic. That is why sub-size specimens are typically discussed as part of the same overall Charpy testing framework rather than as a separate test method.
What Counts As Miniaturized
Miniaturized Charpy specimens belong to a different category. ASTM E2248 applies specifically to miniaturized Charpy V-notch specimens and draws a clear distinction between miniature testing and ordinary sub-size testing under ASTM E23 or ISO 148-1. These test pieces are shorter than conventional sub-size specimens and are designed so that the stress fields governing fracture remain similar to those in standard Charpy testing.
Several miniature specimen families appear regularly in technical work. Common examples include:
- KLST: approximately 27 mm long, with a 3 mm thickness and 4 mm width
- RHS: approximately 24.13 mm long, with section dimensions near 4.83 × 4.83 mm
- HS: approximately 27.5 × 5 × 5 mm
These geometries are not just smaller pieces cut from the standard specimen family. They are purpose-defined miniature formats used for limited material volumes, correlation studies, and small-scale verification work. ASTM E2248 also allows miniature testing to be performed either on a conventional Charpy machine equipped with modified anvils and striker geometry or on a smaller-capacity machine designed for low-energy testing.
Why This Distinction Matters
The difference between sub-size and miniaturized testing affects interpretation from the start. The applicable standard changes, the specimen assumptions change, and the comparability logic changes with them. A reduced-thickness E23 or ISO 148-1 specimen is still being interpreted within the conventional Charpy geometry family. A miniature specimen under ASTM E2248 is being interpreted within a separate framework created for short-format testing.
This distinction also matters at the equipment level. Miniature testing may require modified supports, striker configuration, and machine capacity choices that are not part of routine full-size or ordinary sub-size testing. At lower absorbed-energy levels, machine sensitivity and verification become more important as well, which makes miniature-specimen setup more dependent on the details of the test system.
When a report refers to “small Charpy specimens,” the specimen family should be identified before any comparison is made. Sub-size and miniaturized data may both be useful, but they are not interchangeable and should not be interpreted on a shared dimensional or standards basis.
Standards And Test Method Considerations
 Standards shape the technical boundaries of Charpy testing, but they do not all address specimen size in the same way. In practice, engineers usually need three things from this part of the framework: clear specimen definitions, clear reporting rules, and confidence that the machine and test setup are suitable for the energy range being measured. That is why ASTM E23, ISO 148-1, and ASTM E2248 should be read as complementary references rather than as interchangeable documents. Each one applies to a different part of the specimen-size discussion and helps define how results should be generated, documented, and interpreted.
ASTM E23
ASTM E23 is the main North American framework for notched-bar impact testing and remains the primary reference point for conventional Charpy work in metallic materials. It defines absorbed energy as the work required to fracture the specimen in a single swing and also provides the core terminology used in reporting, including lateral expansion as a measure tied to post-fracture ductility.
The standard also places strong emphasis on machine verification. Direct and indirect verification are part of the control framework, and routine machine condition checks matter for data quality. One detail that becomes more important with smaller specimens is free-swing performance: friction and windage losses should remain within the specified limit, because measurement error becomes a larger fraction of the recorded result as absorbed energy decreases. In practical terms, low-energy testing is less forgiving of machine drift, bearing issues, latch-height problems, or indicating-device error.
For engineers working with reduced-size specimens, ASTM E23 is useful because it establishes the general Charpy testing baseline: specimen concepts, absorbed-energy interpretation, ductility-related reporting terms, and the verification discipline needed to trust the machine output.
ISO 148-1
ISO 148-1 provides the core international framework for the Charpy pendulum impact test and gives explicit dimensional guidance for both standard and sub-size test pieces. For sub-size V-notch testing, it lists reduced-thickness options of 7.5 mm, 5 mm, and 2.5 mm while retaining the conventional specimen family format.
Its reporting requirements are especially useful in mixed-size testing programs. When a non-standard specimen is used, the specimen size must be stated in the test report. The standard also supports broader reporting where needed, including lateral expansion, shear fracture appearance, transition curves, transition temperatures, criteria used for defining transition, and verification-related details. That makes ISO 148-1 particularly helpful when a lab needs to document not only the absorbed-energy result, but also the basis on which transition behavior was interpreted.
ISO 148-1 also ties testing practice to verification discipline through the ISO 148 series. That matters because smaller-specimen testing often produces lower energies, and at lower energies both uncertainty and machine capability become more visible in the final result.
ASTM E2248
ASTM E2248 belongs in the discussion only when the subject is miniaturized Charpy testing. It is not the standard for ordinary reduced-thickness sub-size specimens under the conventional E23 or ISO 148-1 framework. Its scope separates miniature Charpy V-notch testing from standard sub-size practice and makes clear that the two should not be treated as the same category.
The standard is built around miniature test pieces that are shorter than conventional sub-size specimens and intended to preserve similar fracture-controlling stress fields relative to standard Charpy testing. It also allows testing on either a modified E23-type pendulum machine or a smaller-capacity machine suited to low-energy measurements. That makes ASTM E2248 important in programs where material volume is very limited or where miniature specimen families such as KLST, RHS, or HS are being used intentionally.
Why Standards Do Not Remove Interpretation Risk
Standards define how to prepare, run, verify, and report a Charpy test. They do not make different specimen sizes automatically interchangeable. A standards-compliant full-size result and a standards-compliant sub-size result may both be valid, while still representing different constraint conditions and different transition behavior.
That distinction matters in real decisions. Engineers often need to compare impact data against historical datasets, internal acceptance limits, or material specifications that were built around full-size specimens. The existence of a permitted sub-size format does not, by itself, create a universal conversion path back to full-size meaning. Interpretation still depends on material class, fracture regime, temperature range, and the way the comparison is made.
Practical Interpretation: What Engineers Should Watch For
Interpreting sub-size Charpy data is less about finding one conversion rule and more about controlling the comparison. Geometry, fracture regime, machine capability, and reporting basis all influence how far a reduced-size result can be carried into a practical decision.
Do Not Compare Numbers Without Matching Geometry
Specimen size should be identified before any comparison is made. A reported absorbed-energy value has limited meaning on its own if the geometry behind it is unclear. Full-size, 3/4-size, 2/3-size, 1/2-size, and 1/4-size specimens do not represent the same fracture conditions, even when they come from the same heat and are tested at the same temperature. ISO 148-1 requires non-standard specimen size to be reported for this reason.
The same principle applies when miniature formats enter the picture. Reduced-thickness sub-size specimens and short-format miniaturized test pieces should not be merged into one unlabeled dataset. Once specimen family changes, the interpretation basis changes with it.
Check Whether Acceptance Criteria Were Written For Full-Size Data
Many acceptance limits and historical benchmarks were developed around full-size Charpy specimens. That matters because a full-size requirement is not automatically transferable to a sub-size result, even when both tests are standards-compliant. A smaller test piece may produce a lower energy value, a shifted transition curve, or both, without representing the same fracture condition as the full-size reference basis.
Before comparing sub-size data against a specification, engineers should confirm whether the acceptance criterion was written for standard geometry only, whether a qualified sub-size correlation already exists for that material class, and whether the comparison is being made in the same fracture regime. Without that alignment, the comparison may look precise while carrying the wrong meaning.
Be Careful With Transition-Temperature Comparisons
DBTT comparisons are strongest when they are based on fitted curves and a clearly defined transition criterion, not on isolated values pulled from different specimen types. In ferritic steels, reducing thickness often shifts the apparent transition temperature downward because of reduced through-thickness constraint, so a lower DBTT from a smaller test piece does not automatically translate into a full-size equivalent.
A practical comparison should therefore be made curve-to-curve. That means using matched temperature points, fitted transition behavior, and a stated criterion for the transition metric being used, whether based on absorbed energy, lateral expansion, or fracture appearance. This becomes even more important when very small formats are involved, because some 2.5 mm datasets have shown weak temperature sensitivity, which makes transition-based scaling less dependable.
Review Machine Capability And Low-Energy Resolution
As absorbed energy decreases, machine performance matters more. Verification status, indicating-device behavior, friction and windage loss, and the lower useful range of the machine all become more visible in the final number when testing small or low-energy Charpy bars. ASTM E23 includes free-swing and friction/windage requirements for that reason, and those checks become more consequential as measured energies get smaller.
In small-specimen and miniature testing, verification materials and low-energy machine capability deserve explicit attention. NIST maintains Charpy verification guidance and small-specimen reference materials for reduced-energy work, reflecting the fact that low-energy measurements place tighter demands on setup quality and machine sensitivity.
Report The Setup Clearly
A useful Charpy result should describe the testing conditions clearly enough that another engineer can understand how the number was generated. At minimum, reporting should state specimen size when it differs from standard. When cross-lab or cross-program comparison matters, the report should also make the striker configuration explicit, because striker radius can affect comparability and is already encoded in ISO absorbed-energy notation such as KV2 and KV8.
Where relevant, the setup record should also include:
- specimen size and specimen format
- striker radius or notation basis
- lateral expansion and shear fracture appearance criteria, if used
- test temperature and transition criterion, if a DBTT value is reported
- verification status of the machine and any relevant setup notes
Treat Correlations As Material-Dependent
Correlation methods should be treated as material-dependent tools, not universal shortcuts. Ferritic steels are especially sensitive because specimen size affects both absorbed energy and transition behavior through constraint changes. Very small thicknesses, particularly 2.5 mm, require extra caution because several studies have shown that their response may not preserve the same transition behavior seen in larger specimens.
The same caution applies across alloy classes. BCC ferritic steels, FCC austenitic alloys, and different toughness levels do not respond to size reduction in the same way. A correlation that works reasonably well for one steel family in one temperature range may fail when moved to a different alloy or fracture regime. Any conversion rule should be treated as conditional until it has been demonstrated for the material and specimen family in question.
Common Mistakes When Interpreting Smaller-Specimen Charpy Data
Many problems in reduced-size Charpy work begin after the test is finished. The data may be valid, but the comparison, reporting, or scaling logic can still introduce avoidable error.
Assuming Linear Energy Scaling Always Works
Simple area-based scaling is easy to apply, which is why it shows up so often in practice. The problem is that it does not reliably preserve meaning across all materials and temperature ranges. In ferritic steels, specimen size affects fracture constraint as well as ligament size, so the relationship between full-size and reduced-size energy is not purely geometric. The risk becomes even greater in the transition region, where fracture mode is already changing rapidly with temperature.
Mixing Sub-Size And Miniaturized Data
Sub-size specimens and miniaturized specimens should not be treated as one category. Reduced-thickness Charpy test pieces remain within the conventional full-length specimen family, while miniature formats such as KLST, RHS, and HS follow a different dimensional basis and are addressed separately in ASTM E2248. Once these categories are mixed without clear labeling, the comparison loses technical clarity.
Ignoring Specimen Geometry In Reporting
A Charpy value without specimen geometry is incomplete. If the report does not identify whether the specimen was full-size, 7.5 mm, 6.67 mm, 5 mm, 2.5 mm, or miniature, the number becomes much harder to interpret correctly. ISO 148-1 requires non-standard specimen size to be reported for exactly this reason.
Treating 2.5 Mm Data Like A Normal Transition Curve
Very small sub-size specimens need extra caution. Some recent plate-steel data showed that 2.5 mm specimens became relatively insensitive to temperature, which weakens the usual transition-curve logic and makes full-size equivalence harder to justify. Results at this thickness can still be useful, but they should not automatically be read as though they behave like a standard Charpy transition dataset.
Looking Only At Absorbed Energy
Absorbed energy is important, but it is not the whole result. Lateral expansion and shear fracture appearance can provide needed context, especially near the transition range where fracture mode matters as much as the headline energy value. When those indicators are ignored, two results can appear similar numerically while representing different fracture behavior.
When Sub-Size Charpy Testing Is Useful And Worthwhile
Sub-size Charpy testing has clear practical value and should not be treated as a second-rate option by default. In many programs, it is the only realistic way to generate impact data from the material that actually matters. That includes thin products, weld zones, heat-affected zones, limited-volume extractions, and in-service samples where a full 10 mm test piece cannot be machined without losing the location or the purpose of the test. ISO 148-1 explicitly accommodates this reality through its sub-size specimen options, and technical work on steels continues to rely on reduced-size testing in exactly these cases.
It is also useful when the engineering question is comparative rather than absolute. Sub-size testing can support heat-to-heat screening, location-to-location comparison, weld-zone assessment, surveillance programs, and limited-material evaluation, where the goal is to understand relative behavior under consistent conditions. In those situations, reduced-size Charpy data can provide meaningful engineering guidance even when a direct full-size equivalent is not the main objective.
The value of sub-size testing depends on how the results are handled afterward. The data becomes much more useful when the specimen size is reported clearly, the machine and setup are appropriate for the measured energy range, and the interpretation reflects the actual material class and fracture regime. That point is especially important in ferritic steels, where specimen size can shift transition behavior as well as absorbed energy.
Sub-size Charpy testing is most useful when its limits are acknowledged upfront. It can support sound engineering decisions, but the result should be read within the context of specimen geometry, standards basis, and correlation limits rather than forced into a universal full-size equivalent.
Why Specimen Size Still Deserves Careful Interpretation
Specimen size changes more than the recorded Charpy value. It changes the fracture conditions behind the result and, with them, the way impact data should be interpreted in practice. Reduced-size testing can still provide useful, technically valid information, especially when full-size test pieces cannot be extracted from the material of interest. The important point is to evaluate that data on its actual basis rather than treating it as an automatic stand-in for full-size performance.
Reliable decisions usually depend on a combination of factors: standards-compliant testing, clear reporting of specimen geometry and setup, disciplined interpretation of transition behavior, and an understanding that size effects do not develop the same way in every material class. When those elements are in place, sub-size Charpy testing becomes a practical tool rather than a compromise.
For labs and manufacturers working with full-size, sub-size, or low-energy impact testing, the test system matters as much as the method. Fixture configuration, specimen support, machine verification, and reporting consistency all affect how confidently the result can be used. NextGen Material Testing offers Charpy and impact testing equipment designed for standards-aligned workflows, including applications where reduced-size specimen handling and low-energy test control require added attention.
 Flexural (Bend) Testing Explained: 3-Point vs 4-Point, Standards, and SetupFlexural (bend) testing explained: what it measures, three-point vs four-point setups, the standards for plastics, metals, composites and concrete, and how to choose the right fixtures and...Read the articleGenTest Software Setup Guide for NextGen NG-EML Universal Testing MachinesGenTest setup affects the full UTM testing workflow: method storage, PC-to-controller communication, user permissions, simulation files, live data acquisition, and report output. This guide follows the GenTest setup video step by step for NextGen NG-EML electromechanical universal testing machines. It covers installation, license activation, workspace configuration, UTM controller connection, safety and peripheral setup, user management, DEMO Mode, simulation files, Control Panel setup, Quick Test, and test method creation. GenTest is the software layer where the test method, machine connection, operator input, live data, calculated results, and report output come together. For operators, service teams, QA/QC labs, and R&D users, the goal is to...Read the article
Machines Behind This Article
 Pendulum Impact TestersClass J – Automatic Charpy and Izod Impact Tester (1–50 J)Class J is an automatic Charpy and Izod impact testing system for low-energy impact evaluation of plastics and related materials. It covers 1–50 J for Charpy tests...View product
 Pendulum Impact TestersClass D – Single-Column Charpy Impact TesterClass D is a single-column Charpy impact tester for high-energy pendulum testing of metallic specimens up to 750 J. It supports 150 J, 300 J, 450 J, 600 J, and 750...View product
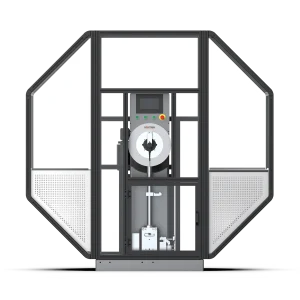 Pendulum Impact TestersClass G – Single-Column Charpy and Izod Impact TesterClass G is a single-column Charpy and Izod impact tester for high-precision pendulum testing of metals and engineering materials. Available in 450 J and 750 J...View product
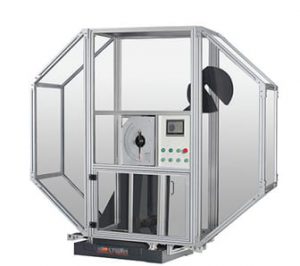 Pendulum Impact TestersClass H – Dual-Column Charpy Impact Tester (300–750 J)Class H is a servo-motor dual-column Charpy impact tester for high-volume metal impact testing of hard materials. Available with 300 J, 450 J, 600 J, or 750 J...View product
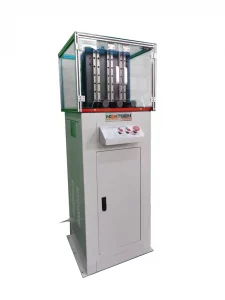 Pendulum Impact TestersTriple-Specimen Motorized Charpy Notching MachineGenNotch 4000UPG is a motorized Charpy notch making machine designed to prepare three impact specimens in one cycle. Built for V-type and U-type notches used in...View product
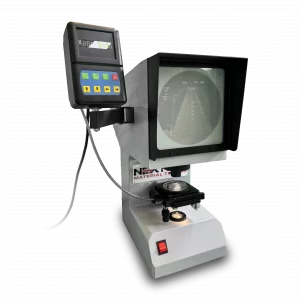 Pendulum Impact TestersNG-NPS-CIS – Charpy/Izod Notch Verification ProjectorNG-NPS-CIS is a Charpy/Izod notch verification projector for precise inspection of U- and V-type impact specimens. Built for laboratories working to ISO 148, ASTM...View product
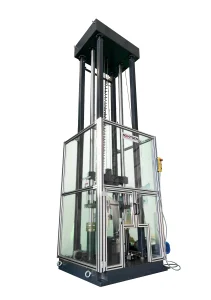 Pendulum Impact TestersDWT-1800 – Computer-Controlled Drop Weight Impact TesterDWT-1800 is a computer-controlled drop weight impact testing machine for evaluating impact resistance in metal and non-metal materials. Capable of high-energy tests...View product
 Pendulum Impact TestersNG-ISCC Series – Impact Specimen Cooling ChamberNG-ISCC Series is a low-temperature chamber for conditioning Charpy impact specimens before pendulum impact testing. Available in -60°C, -80°C, -100°C, and -196°C...View product
 Pendulum Impact TestersGenChamber – Impact Specimen Cooling and Heating ChamberGenChamber is an impact specimen cooling and heating temperature chamber for conditioning Charpy and Izod specimens before pendulum impact testing. It provides...View product
 Pendulum Impact TestersSpecimen Notching and Broaching MachineGenNotch 4000 is a motorized specimen notching and broaching machine for preparing Charpy and Izod impact specimens in metals. Its dual broaching system prepares...View product