A tunnel boring machine can cut through hard rock for months, but it does so by wearing out steel. Disc cutters, drag picks and drill bits lose material with every metre, and on a long drive the cost of changing them becomes one of the largest lines in the budget. Before a contractor bids on that work, someone has to answer a simple question about the rock: how quickly will it eat the tools?
The most widely used laboratory answer is a scratch. A sharpened steel stylus is loaded against a piece of the rock and drawn across it for ten millimetres, and the small flat worn on its tip becomes a number, the Cerchar Abrasivity Index, or CAI. The test takes seconds and the apparatus fits on a bench, which is a large part of its popularity. This guide explains what the CAI measures, the choices that move it, how to read the value against the classification tables in use, and what the number can and cannot tell a project about tool wear.
What the Cerchar Abrasivity Index Measures
The method comes from France, where the Centre d’Etudes et Recherches des Charbonnages de France, known as Cerchar, developed it for the coal mining industry in the 1970s and wrote it up as a recommendation in 1986. It has since been standardised several times: as AFNOR NF P94-430-1 in France in 2000, as ASTM D7625 in 2010, revised in 2022, and as a Suggested Method of the International Society for Rock Mechanics published in 2014. All of them keep the same core.
A steel stylus with a 90 degree conical point is pressed onto the rock with a force of 70 N, roughly the weight of a 7 kg mass, and moved 10 mm across the surface. The rock grinds the point down to a small flat. The diameter of that flat, measured in millimetres and multiplied by ten, is the CAI for that scratch. A flat of 0.30 mm gives CAI 3.0, and each index point stands for a tenth of a millimetre of wear. The reported CAI is the mean of several scratches, each made with a fresh point.
The scale is short. Values run from a few tenths for soft, fine rock to about six or seven for quartz-rich rock, and most practical decisions are made between 1 and 5. Two things follow from the geometry. First, small reading errors matter: the difference between “medium” and “high” in some tables is a few hundredths of a millimetre on the tip. Second, the amount of steel removed does not rise in step with the index. The worn-off part of the tip is a tiny cone whose volume grows with the cube of the flat’s diameter, so a CAI 5 rock removes about 125 times as much steel from the stylus as a CAI 1 rock, not five times as much.
ASTM describes abrasiveness as a behaviour of rock rather than a basic physical or mechanical property, and that framing is useful. The CAI is not the hardness of the rock or its quartz content, although it is related to both. It is the result of one particular steel meeting one particular rock surface under one load, and that is why the details of the test carry so much weight.
Two Apparatus Designs, One Index
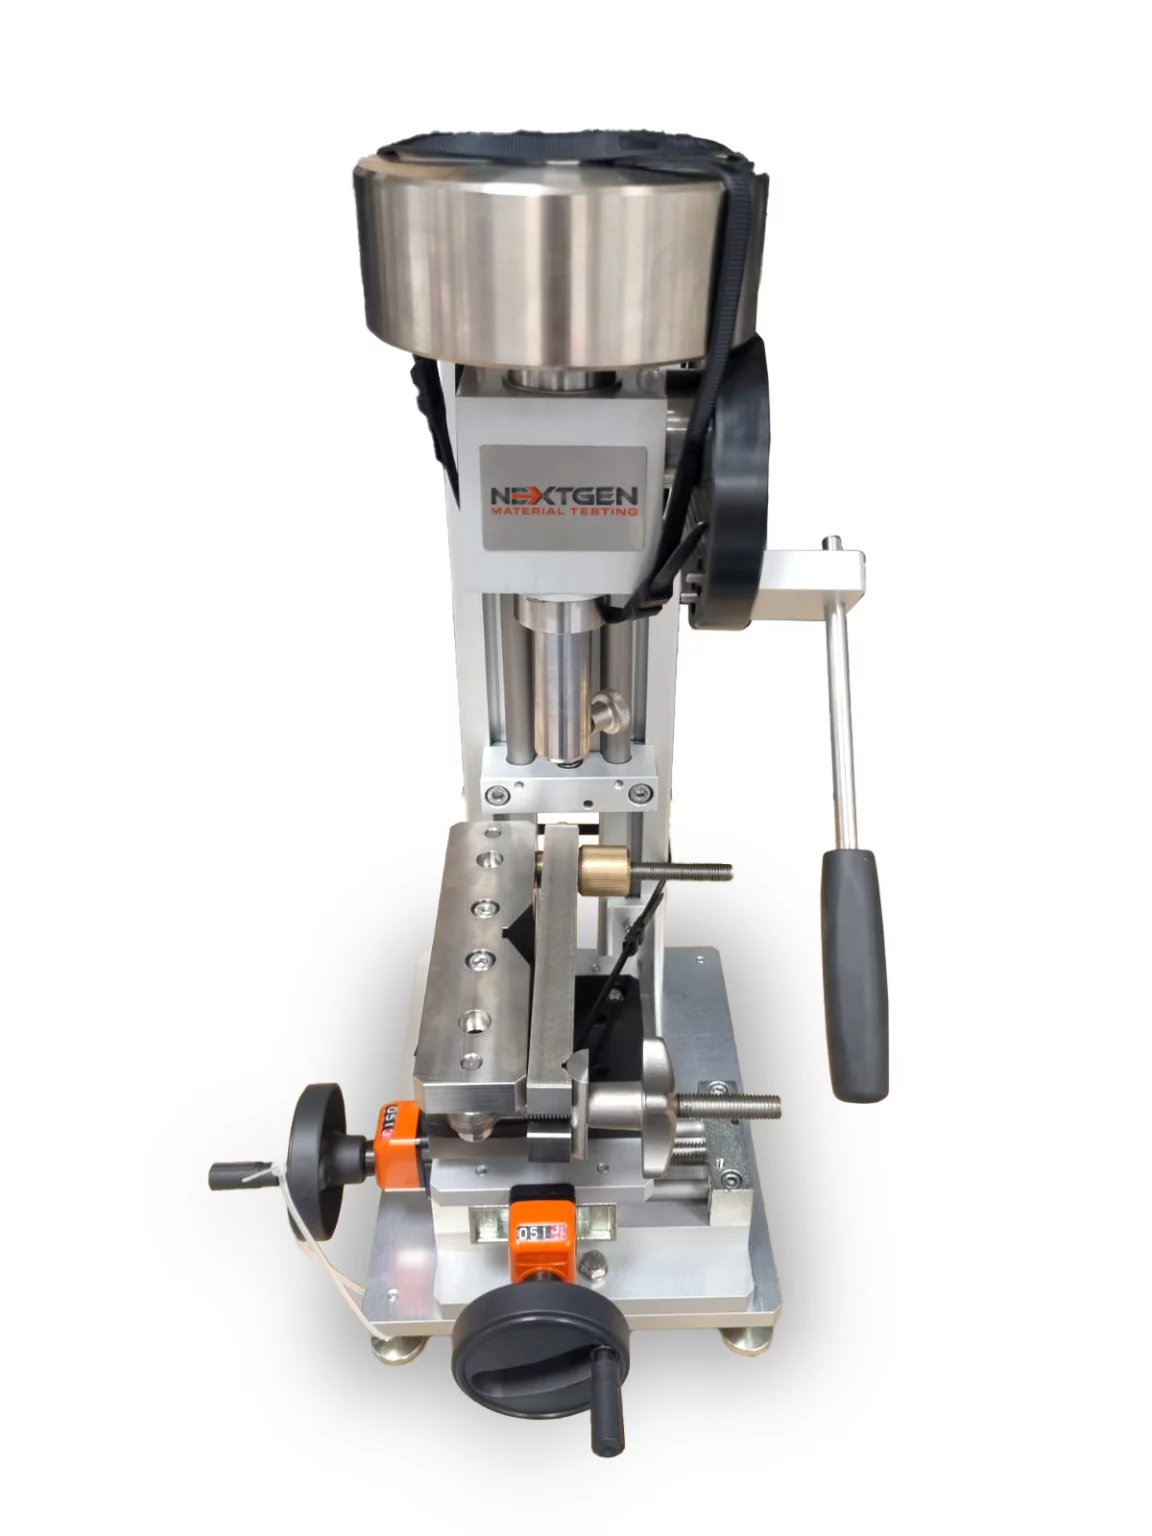
Two families of apparatus are in use, and they differ in what moves. In the original Cerchar design the rock is clamped and the loaded stylus, held on a hand lever, is dragged across it. The scratch takes about one second, a speed of roughly 10 mm per second. In the design introduced by West in the late 1980s, the stylus stays still under a deadweight and the rock moves beneath it on a sled driven by a hand crank. Each turn advances the sample by one millimetre, so the 10 mm scratch takes ten turns and about ten seconds.
ASTM estimates that the two designs give the same CAI, and in practice laboratories report results from both on one scale. Research has looked for differences and has not agreed on their direction. One German study found that the original apparatus read lower on heterogeneous rock and judged the West design more stable, while a Turkish comparison on 13 rocks found the original apparatus slightly higher, by about one percent, which amounts to no meaningful difference. Speed itself appears to have little or no effect on the result at these slow rates. The practical concern with the faster stroke is control: on very rough surfaces or coarse grains the stylus can jump, and a bounced stylus wears irregularly. The slower, crank-driven scratch of the West design makes steady contact easier to keep.
The West Cerchar Abrasivity Index Tester we supply follows the West layout. A stiff load frame carries the stylus under a 70 N deadweight, a rigid vice clamps the rock, and a cross table with two adjustable axes lines the specimen up under the point. A graduated knob controls the scratch distance to 0.01 mm, and the vice takes specimens up to 75 mm in diameter and 150 mm high. The test runs at 10 mm in 10 seconds, the speed the method sets for this design.
Newer research instruments add motors, load cells and displacement sensors, and record the scratching force and how deep the point sinks during the scratch. They are useful for studying the mechanism. A recent review reports average scratching forces between about 46 and 85 N across eight rock types. For routine classification, though, the manual apparatus remains the reference that the standards are written around.
The Stylus Decides the Number
If the rock is the thing being measured, the stylus is the instrument, and most of the disagreements between laboratories trace back to it. Its geometry is settled: every published version of the method calls for a 90 degree cone. Its steel and hardness are where practice has differed.
Hardness and Why It Must Be Stated
The original Cerchar recommendation used steel with a tensile strength of about 2000 MPa, which corresponds to a hardness of HRC 54 to 56. The French standard keeps that range, ASTM centres on HRC 55, and the ISRM method asks for HRC 55 plus or minus one. West, however, used a softer steel hardened to about HRC 40, and for years laboratories in different countries tested with whatever pins their apparatus came with. A summary written by German researchers notes that these differences in steel and procedure caused additional costs and delays on tunnels in Europe, North America and Australia.
The effect is large and consistently in the same direction: a softer stylus wears more and reports a higher CAI. Three published conversions from an HRC 40 stylus to the HRC 55 reference give factors of roughly 0.6, 0.7 and 0.73, so a reading made with a soft pin can overstate the standard value by a third or more. The 2022 edition of ASTM D7625 now states plainly that CAI varies inversely with stylus hardness and that results from other hardnesses have to be normalised to the standard. The Rockwell C scale is how that hardness is specified and checked, and it belongs in every CAI report alongside the result.
Some researchers have suggested going the other way for weak rock. A 2025 review proposes considering HRC 40 to 42 styli for soft rocks such as siltstone and mudstone, because a hard point sinks into them and wears on its side rather than at the tip. That is a research proposal rather than standard practice, and anyone who adopts it has to report the hardness and convert the result.
A Fresh Point for Every Scratch
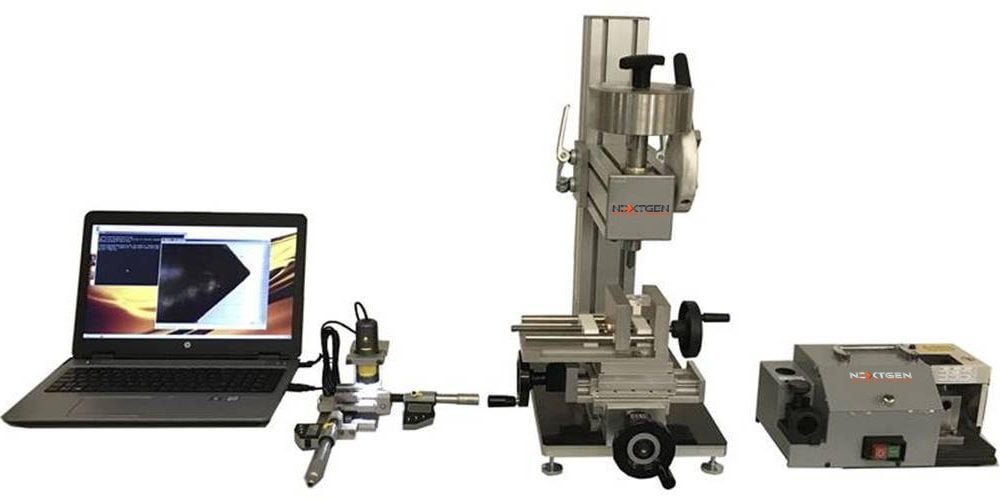
Each scratch uses a new or re-sharpened point, because the flat left by one scratch would change the next. That makes stylus supply a real part of running the test. Our tester’s optional accessories include a set of 100 specialty stylus pins and a sharpening tool that grinds a worn pin back to a 90 degree cone 1 mm long. At five scratches per sample, a hundred pins cover about twenty tests before any sharpening is needed.
Sharpening has its own trap. The point is small, and if it is ground too quickly the heat can soften the steel at the tip. A softened tip wears like a softer stylus, which, as described above, inflates the CAI. Researchers at the Technical University of Munich recommended gentle resharpening and stating the steel quality in every test report for this reason.
- Use HRC 55 steel, plus or minus one in the ISRM method.
- A softer pin reads higher: published conversions from HRC 40 to HRC 55 use factors of roughly 0.6 to 0.73.
- Use a new or re-sharpened point for every scratch, because the flat from one scratch would change the next.
- Sharpen gently: heat can soften the tip, and a softened tip inflates the CAI.
- State the stylus hardness in every report and normalise other hardnesses to the standard.
Preparing the Rock Surface
The scratch is short, but the surface it runs on has as much influence as the stylus. Two kinds of surface are used, and the standards rank them.
Freshly Broken or Saw-Cut
The preferred surface is a freshly broken one, produced by splitting the rock with a hammer or a press. It resembles what a cutter meets in the ground, and it gives a conservative, higher CAI. The original recommendation, ASTM and the ISRM method all favour it. ASTM allows a saw-cut surface when a satisfactory broken surface cannot be obtained, and the 2022 edition names the usual cases: conglomerates, coarse-grained granite and schistose rock, where breaking leaves a face too uneven to scratch.
A saw-cut face reads lower, because the smooth surface gives the point less to bite into, and on hard, strong rock the stylus can ride up rather than cut. Several equations have been published to convert a saw-cut result to the rough-surface value. The 2010 edition of ASTM used one that adds about half a point, the ISRM method is reported to scale the wear flat by 1.14, and other researchers fitted their own lines from their own rock sets.
Drawn together, the corrections show something a single equation hides. At high abrasivity they agree closely: a saw-cut CAI of 4.0 becomes somewhere between 4.38 and 4.56 whichever line is used. At low abrasivity they spread out, and a saw-cut 1.0 becomes anything from 0.95 to 1.47, half a class in most tables. The 2022 edition of ASTM allows either of two normalising equations. For soft and medium rock in particular, a report should say which surface was scratched and which correction, if any, was applied. Some researchers prefer saw-cut surfaces for exactly the opposite reason: the scatter between repeat scratches is lower, even if the absolute value has to be corrected.
Direction, Moisture and Specimen Size
Many rocks are not the same in every direction. Slate, schist and gneiss have a foliation, and a scratch along the layers may meet different minerals from a scratch across them. The original method gave no guidance on this. Later work proposed scratching parallel to, perpendicular to and across the foliation, and the ISRM method advises testing both on and orthogonal to the anisotropic surface. One study of slate and gneiss at angles from 0 to 90 degrees found no clear dependence on direction, but the 2025 review still recommends at least two scratch directions for foliated rock. Our product page puts the same idea in practical terms: before clamping, choose a location and direction that represent the dominant mineralogy and texture of the sample, not the most convenient flat spot.
Water lowers the result. One published fit puts the CAI of saturated rock at roughly 0.8 of its dry value, and ASTM asks laboratories to record the actual moisture condition, whether as received, saturated, air dried or oven dried, when results are sensitive to it.
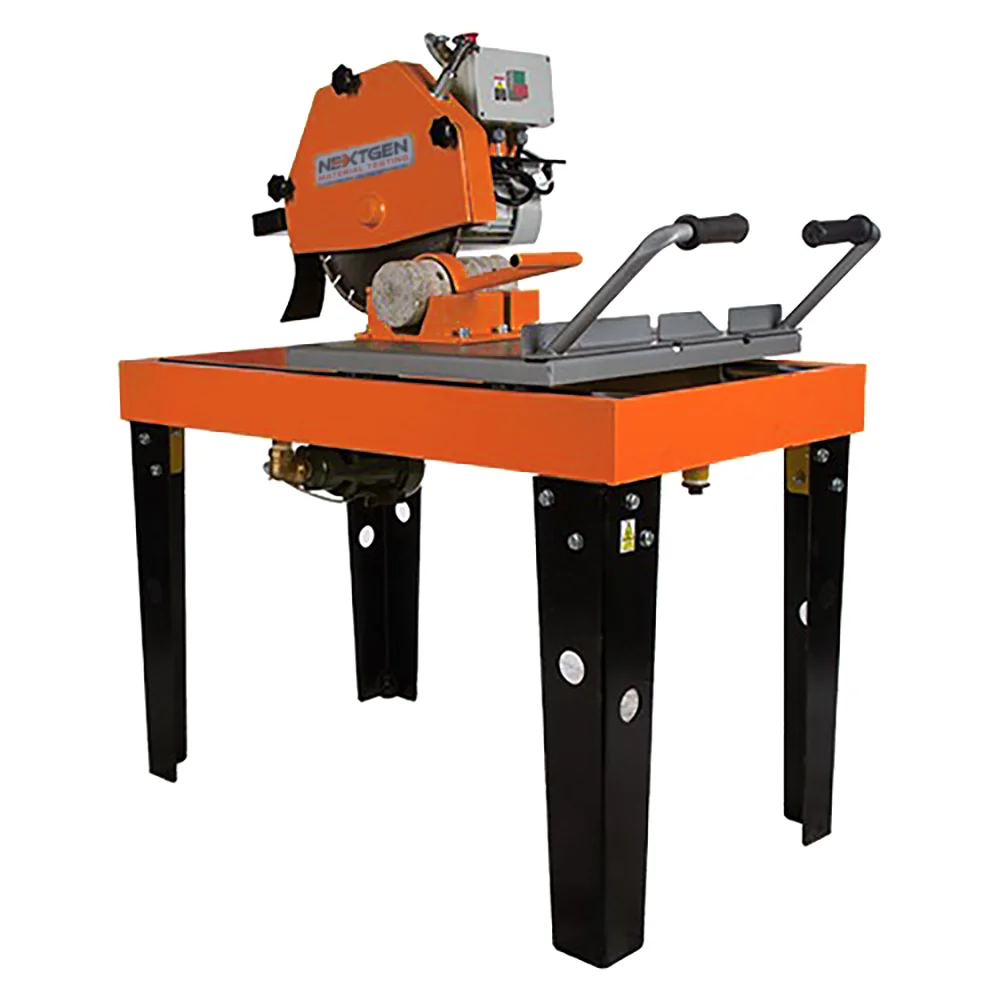
Sources disagree on a minimum specimen size, so the practical limit is usually the vice. Our tester takes specimens up to 75 mm in diameter and 150 mm high, which accepts common drill core sizes directly. Larger cores and irregular blocks are cut down first on a rock core cutter and masonry saw, and our article on the core cutter and saw for rock, concrete and masonry covers that step. The sample is then clamped hard enough that it cannot shift while the stylus passes over it.
Measuring the Wear Flat
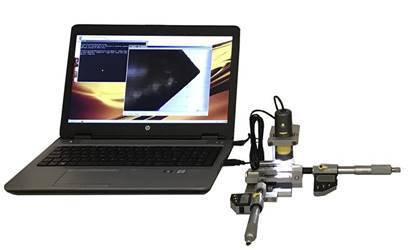
The scratch takes ten seconds. Measuring what it did to the point takes longer and introduces more error than any other step. The flat is a few tenths of a millimetre across, so it is read under magnification: our product page calls for a microscope of at least 25x, other sources cite 30x for the 2010 ASTM edition, and the Munich laboratory used a reflected-light microscope at 50x with a measuring eyepiece. That laboratory put the reading error at about 0.02 mm, which is 0.2 on the CAI scale.
The flat can be viewed from above or from the side, and the two views do not always agree. The early methods measured from above. The difficulty is a burr: as the point is dragged, steel is pushed toward its trailing side, and from above that burr makes the flat look larger. Many laboratories therefore turn the stylus on its side, reconstruct where the 90 degree cone would have been, and read the flat from the profile, taking readings at several rotations and averaging them. The open accounts of the ISRM method do not agree on which view it prefers, so the safe practice is to state the view used and to remove or ignore the burr.
Not every flat is worth measuring. The usual rule recognises three shapes: a clean, symmetrical flat that is measured directly; an uneven flat that is measured on both sides and averaged; and a ragged or chipped tip, which cannot be read reliably, so the scratch is repeated. Before measuring, rock dust is blown off the tip and the stylus is seated in a holder so it does not rotate during the reading.
Our tester’s optional digital microscope does this work on a screen: an indenter holder with digital micrometers, an XY stage, a video camera and dedicated software, with the computer supplied by the laboratory. Reading the flat on a calibrated image also leaves a record of every tip, which helps when a result is questioned later.
How many scratches make a result? The original recommendation asked for two or three on fine, uniform rock and five or more when the grains are larger than 1 mm. The ISRM method and many laboratories use five per sample, and the 2010 ASTM edition is described as using five, with three parallel scratches and two at right angles when the rock has no preferred direction. For heterogeneous rock that may not be enough: one researcher suggested 20 to 25 single tests, while another study found that five and ten scratches differed by less than 0.2 CAI for about three quarters of the samples tested. Our product page asks for at least five, each with a new or re-sharpened stylus, and a report of the mean with its standard deviation. The spread is part of the answer.
Reading a CAI Value
A CAI is usually reported with a word, and that word depends on which table the laboratory uses. Three are common, and they divide the same scale differently.
The original Cerchar table calls 2.0 to 4.0 very abrasive. The 2010 ASTM table uses the same breakpoints but calls that band high and adds a quartzitic class above 6.0. The ISRM table of 2014 is finer, with a new class every whole point, and calls 2.0 to 2.9 medium. So the same rock, with a CAI of 2.5, can be described as very abrasive, high or medium depending on the table. A CAI of 1.5 is medium-abrasive, medium or low. The number travels well between projects; the word does not. Any report that gives a class should name the table, the stylus hardness and the surface condition.
Typical values help put a result in context. In the 2025 review’s compilation of published data, average CAI was around 4.3 for granite and similar for gneiss and quartzite, about 3 for sandstone with a wide range of roughly 1.5 to 4.5, about 2.5 for basalt, about 1.8 for slate, about 1.5 for marble, around 1 for limestone and dolomite, and about 0.3 for chalk. These are averages over many sources with wide scatter. Sandstone in particular varies with its cement: siliceous, well-cemented sandstone scratches very differently from a weakly cemented one.
The fixed 10 mm scratch also explains a quirk of coarse rock. In a coarse granite or gneiss the point may spend most of its path on one or two crystals, so the result reflects whichever mineral happened to be under the stylus. That is one reason heterogeneous rocks need more scratches, and why a single scratch is not treated as a result.
From CAI to Tool Wear and Cost
The CAI exists because tools are expensive. ASTM states that the method was developed for mechanical excavation and that abrasiveness governs disc cutter performance, cutter replacement and therefore tunnel cost. One often-quoted estimate puts tool wear at about 30 percent of the cost of a rock excavation project. The index is referenced in tunnelling design guidance, and contractors use it, usually together with rock strength, when they estimate cutter, pick and bit consumption.
The published prediction models are numerous. For disc cutters on tunnel boring machines, models relate cutter life or weight loss to CAI, sometimes alone and sometimes together with uniaxial compressive strength. One published model for a 17-inch disc gives a cutter life of about 1026 cubic metres of rock divided by the CAI, which works out to roughly 513 cubic metres per cutter at CAI 2 and 257 at CAI 4. For roadheader and drag picks, consumption per cubic metre or per tonne is tied to CAI, with factors for water jets and cutterhead speed. For drill bits, bit life in metres falls as CAI rises.
The same review that collects these models warns that they give a wide range of predicted lifetimes. Each was built for particular tools and particular ground, and a figure from one cannot be transferred to another machine with confidence. Researchers at the Technical University of Munich, after one of the larger CAI test programmes, concluded that the test supports rough estimates of bit life, pick consumption and disc wear, and no more. A CAI is a classification, not a wear forecast on its own. The rock mass matters too: joints and fractures change how cutters wear, and no laboratory scratch sees them.
CAI has been correlated with other properties, which is useful for checking results and filling gaps. Relations with the equivalent quartz content of the rock are reasonable for metamorphic rocks, weaker for igneous rocks and poor for sedimentary rocks, and limestone, dolomite and marble show no clear trend. CAI also rises with uniaxial compressive strength, though each study found a different slope. It correlates with the point load strength index, which makes the portable point load tester a natural companion test on the same cores. It correlates with the abrasivity coefficient of the LCPC test, at roughly 270 to 300 grams per tonne for each CAI point. Every one of these correlations comes with scatter, and none replaces running the scratch.
Setting Up Cerchar Testing in Your Laboratory
A Cerchar station is small, but it needs the right pieces around it. A typical workflow looks like this: receive the core or block and record its moisture condition; split it to a fresh surface, or saw it where breaking fails; size it to fit the vice; choose the scratch location and direction; make at least five scratches, each with a fresh HRC 55 point; measure every flat under the microscope, from the side where possible; and report the mean, the standard deviation, the stylus hardness, the surface type, any correction and the classification table used.
Most of the decisions that make results comparable happen around the scratch rather than during it: the pin steel, the sharpening, the surface and the reading. That is where a laboratory’s procedure earns its credibility. Our earlier West Cerchar tester review describes the instrument itself, and the rock mechanics testing equipment range covers the cutting and index tests that sit beside it.

Machines Behind This Article
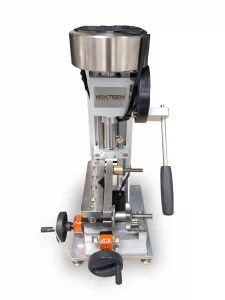 Rock Mechanics TestingWest Cerchar Abrasivity Index TesterThe West Cerchar Abrasivity Index Tester measures rock abrasivity for mining, tunneling, and underground construction applications. Built around ASTM D7625-10, it...View product
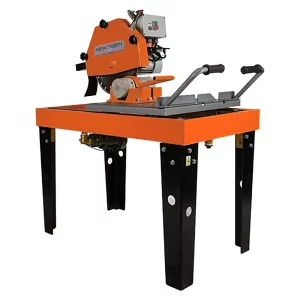 Rock Mechanics TestingRock Core Cutter and Masonry SawThe Rock Core Cutter and Masonry Saw is a universal cutting system for concrete, rock cores, and irregular rock samples. Available with 450 mm or 600 mm blade...View product
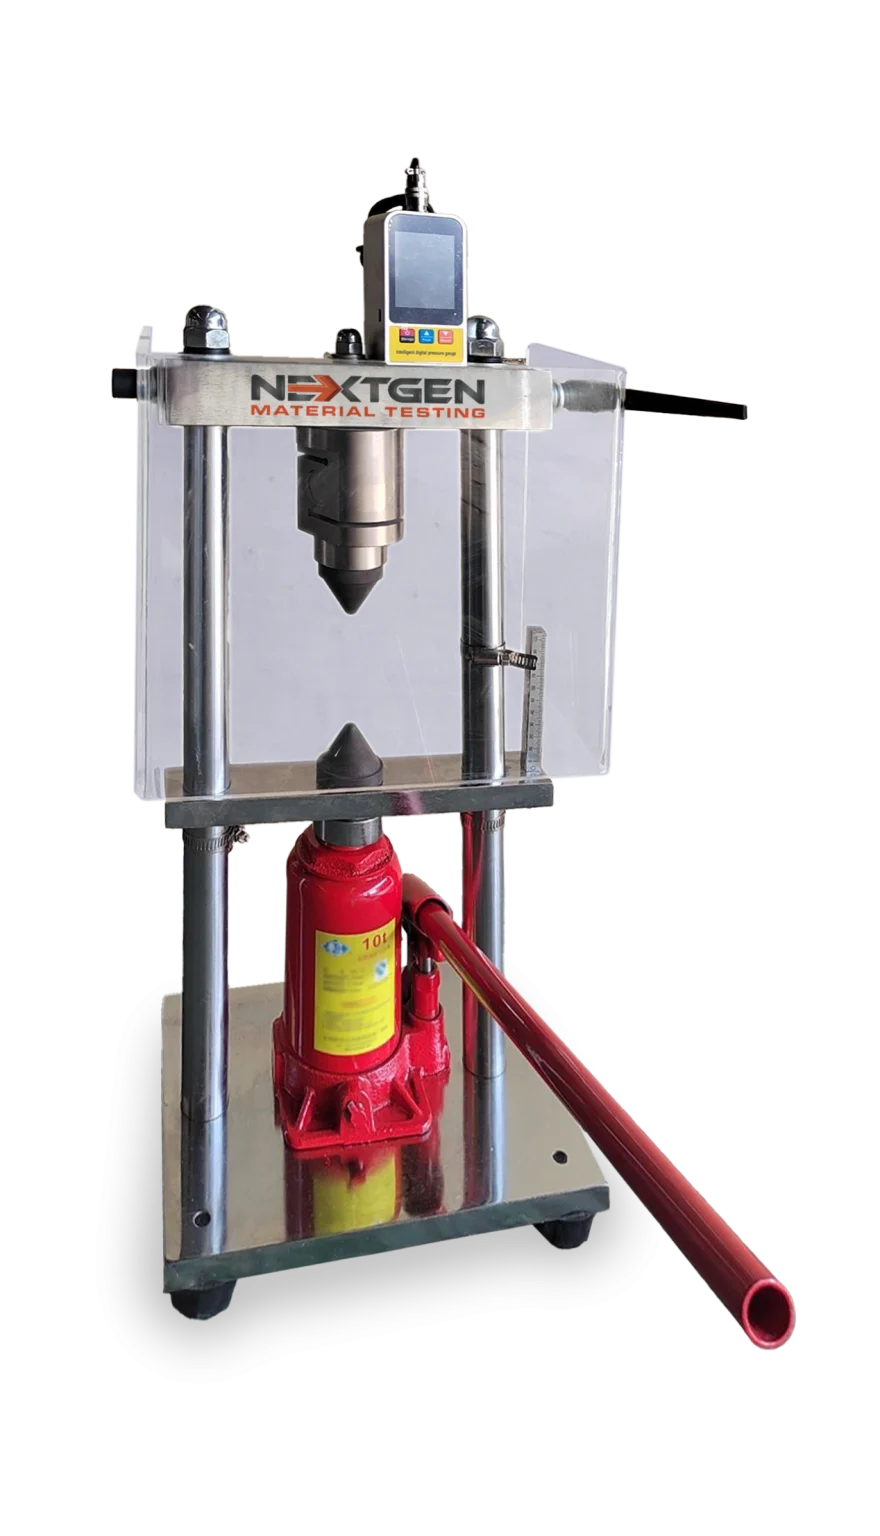
 Rock Mechanics TestingPortable Point Load TesterThe Point Load Tester is a portable rock strength testing system for fast field and laboratory assessment of core samples and irregular rock fragments. It...View product