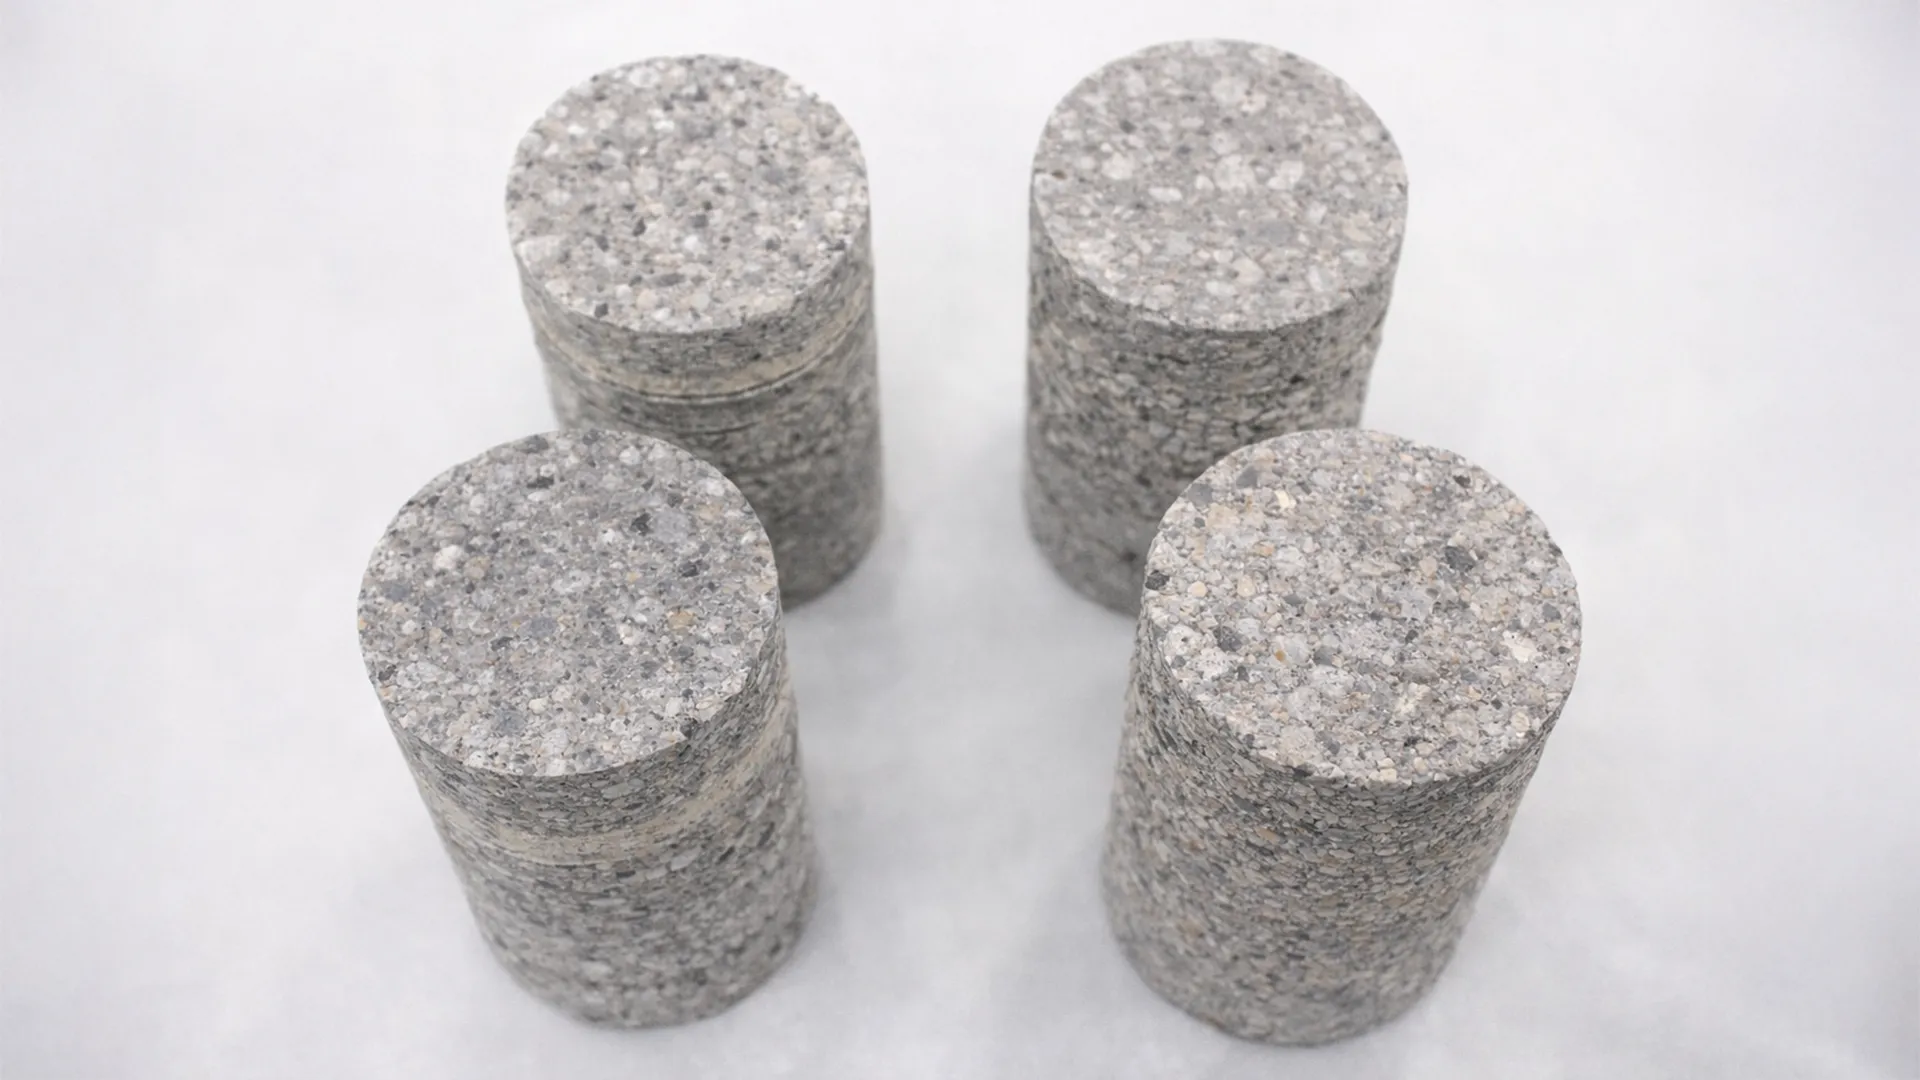
Rock core testing provides the “intact rock” parameters engineers use to inform excavation strategy, stability checks, and deformation expectations in projects like mining, tunneling, and dams. Those lab programs typically report compressive strength (uniaxial or triaxial) and, when stress strain data are captured, stiffness values such as Young’s modulus and Poisson’s ratio.
Even with good testing, intact core results are not the same as in situ rock mass behavior, since joints, weakness planes, and heterogeneity strongly influence real structures. That is exactly why preparation matters: standards treat specimen prep as part of the test, requiring cores to be cut to length and their ends machined flat, with dedicated guidance on meeting and verifying shape tolerances.
In this post, we focus on the two prep steps that most often decide whether your data are clean or noisy: trimming and end grinding. We’ll explain what “good” looks like, what goes wrong, and a practical workflow you can repeat across operators and batches.
What “Good” Rock Core Preparation Actually Means
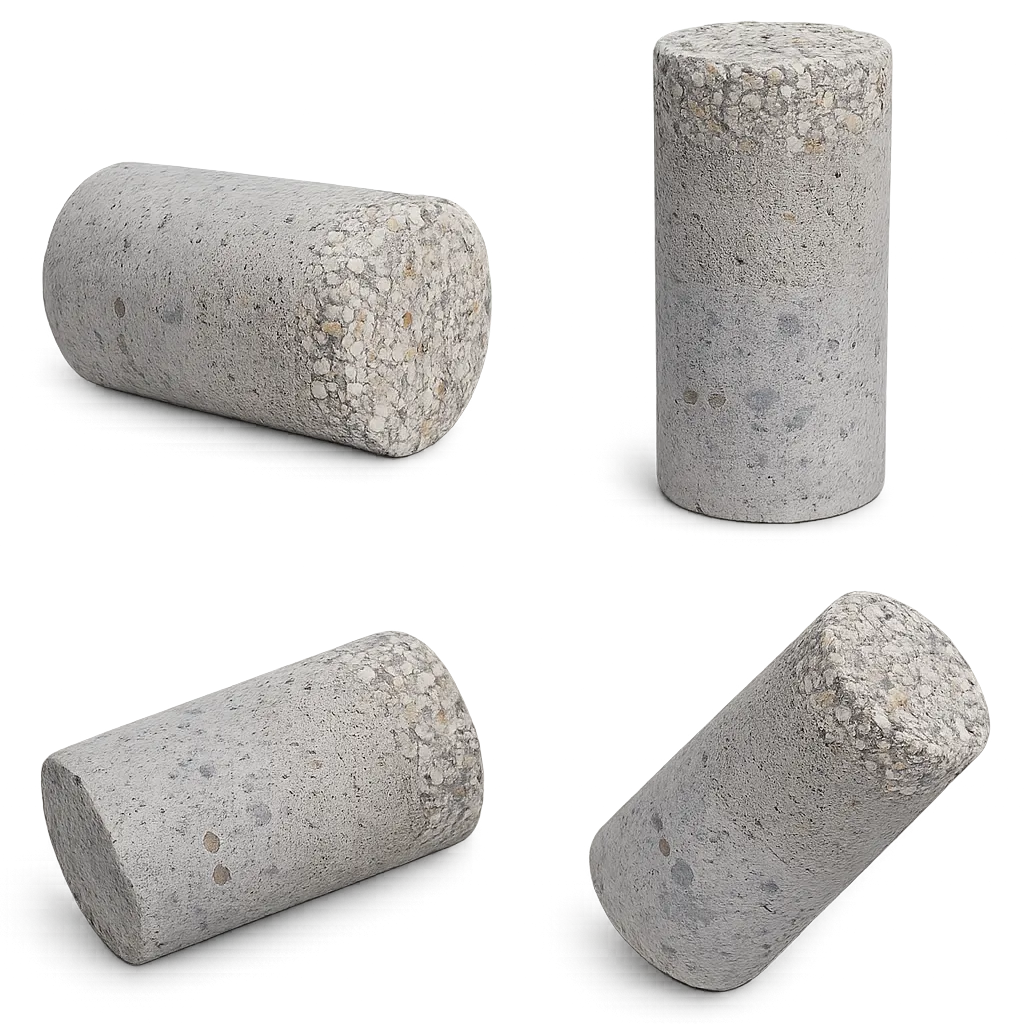
A “test-ready” rock core is not simply a cylinder that fits the loading platens. In standards language, it is a right circular cylinder with controlled geometry and controlled end conditions. ASTM D4543 focuses on verifying that a prepared specimen meets key tolerance checks, including length to diameter ratio, straightness of the cylindrical surface, end flatness, and end perpendicularity relative to the specimen axis.
In plain terms, a good specimen is a straight cylinder of the right size, cut to a standard L/D range, with two end faces that are flat and aligned so the load enters the specimen axially, not through an edge or corner. ASTM D4543 commonly referenced guidance ties this to practical specimen geometry such as L/D around 2.0 to 2.5 and a minimum diameter around 47 mm, plus a representativeness check that the diameter should ideally be much larger than the largest grains or particles in the rock. It also calls out straightness expectations for the cylindrical surface so the specimen is not subtly bowed or irregular along its length.
Most importantly, end preparation is not a “finishing touch.” ASTM D4543 explicitly notes that dimensional, shape, and surface tolerances are especially important for strong rocks and for testing in stiff load frames without a spherical seat, where non-uniform loading can occur. This is the core message for readers: small end condition errors can turn what should be axial compression into uneven contact and misaligned loading.
Good preparation is also realistic. ASTM D4543 recognizes that some rock types may be difficult to machine to ideal tolerances and directs labs to get as close as practicable, document what was achieved, and use permitted remedies such as capping where appropriate. Finally, “good” includes thoughtful orientation when anisotropy matters. ASTM D7012 notes that anisotropy can affect how elastic properties apply and recommends testing relative to foliation, cleavage, or bedding directions to assess directional behavior.
Why Trimming And End Grinding Affect Your Test Results
 Trimming and end grinding control how the load is introduced into the specimen and how the rock actually experiences stress at the boundaries. If the ends are even slightly off, the test can shift from a clean axial compression setup into a mixed, imperfect loading condition that changes both the measured values and the way the sample fails.
Load Alignment And Contact Stress
When an end face is not flat or not perpendicular, the platen often makes contact first along an edge or at a point instead of across the full area. That concentrates stress locally and creates a non-uniform stress field inside the specimen. The practical outcome is familiar in many labs: early crack initiation, abnormal damage near one end, and a failure pattern that does not match what you would expect from a well-prepared core.
Modern numerical modeling backs up this “physics without formulas” explanation. A 2025 open-access study reports that deviations in end-surface geometry (parallelism and perpendicularity) can materially affect uniaxial compression results. In simulations, end defects such as protrusions, grooves, and one-sided warping create localized stress concentrations and can shift the observed failure behavior, including wedging effects and characteristic shear patterns depending on where the defect is located.
This also ties directly to the scatter problem. An open-access review on laboratory variability lists specimen preparation and rock–machine interaction as major contributors, noting that issues like non-parallel loading conditions can create significant scatter that is easily misread as “natural rock variability.”
A related point that helps readers understand why standards care so much: even with excellent grinding, the platen–specimen interface can still create “end effects.” University lecture notes on rock mechanics explain that end platens can restrain lateral deformation and produce a stress state that is not truly uniaxial near the boundaries, and they discuss how attempts to reduce friction (for example with certain lubricants) can introduce their own complications. This is exactly why trimming and grinding are treated as quality-critical steps: you cannot eliminate boundary effects completely, but you can avoid adding preventable geometric errors on top of them.
Why The Problem Gets Worse In Strong Rock And Stiff Test Frames
Small geometric errors matter more when the system is less forgiving. ASTM D4543 notes that dimensional, shape, and surface tolerances are especially important for strong rocks (often referenced above 50 MPa) and for tests run in stiff frames without a spherical seat, where non-uniform loading can occur. In other words, if your setup cannot self-align, your end conditions become the alignment system.
ASTM D7012 adds another practical angle: the stiffness of the load frame relative to the specimen can influence failure strain and even mode of failure. Put together, this explains a common lab reality: with stronger rocks and stiffer systems, tiny end-condition deviations can show up as big changes in contact stress and fracture initiation, so end conditions can dominate scatter even when operator technique is consistent.
Finally, it is not only the peak number that can change. A 2018 study discusses how end effects tied to specimen–platen friction can shift failure from splitting toward shear as friction increases, and it notes that increasing specimen slenderness reduces the influence of end friction on UCS. For a blog reader, that is the takeaway: if boundary conditions differ, two tests on “the same rock” can fail differently, and that difference may come from preparation and contact conditions, not from geology alone.
The Tolerances Everyone Talks About
The “why” behind these tolerances is simple: you are controlling tiny geometry errors so the load enters the specimen as close to axial compression as possible. If the ends are even slightly off, contact pressure shifts toward one side, the specimen sees eccentric loading, and results start reflecting boundary conditions as much as material behavior.
Numbers To Remember
A good way to present tolerances is as typical, standards-based acceptance criteria, with a quick reminder that labs should verify which standard and edition they are working to. A commonly referenced ASTM D4543 excerpt lists targets such as end flatness within 0.001 in (25 μm) and end perpendicularity within 0.25°. The same excerpt also specifies end parallelism limits that depend on the test machine setup: up to 0.25° for spherically seated machines and up to 0.13° for fixed-end machines.
Those end-condition targets sit alongside baseline specimen geometry guidance in the same family of references, including L/D around 2.0 to 2.5, a minimum diameter around 47 mm, and representativeness guidance that the core diameter should ideally be much larger than the largest grains or particles in the rock. ISRM’s classic UCS suggested method supports the same order of magnitude message by requiring very flat ends and tight perpendicularity control.
To help readers believe these tiny numbers matter, you can cite modern research that explicitly links shape tolerances to measured UCS, Young’s modulus, and Poisson’s ratio, and discusses how strict acceptance criteria have historically been based on limited early datasets.
Why “Close Enough” Usually Isn’t
The practical issue with “almost flat” or “nearly square” is that small wedge angles and slight bias in an end face can introduce eccentric loading. What should be a clean compression test starts to behave like compression plus bending, and that can shift crack initiation, increase scatter, and sometimes change the apparent failure character.
These tolerances are also genuinely hard to hit every time. ASTM D4543 acknowledges that some rocks, especially weak, porous, poorly cemented, or structurally fragile materials, may be difficult to machine to desirable tolerances. The standards-aligned approach is “best effort,” report what was achieved, and use permitted remedies such as capping where appropriate. Another real constraint is conditioning: ASTM guidance links specimen moisture condition to strength and deformation characteristics and notes the practical challenge of preserving field moisture when cooling fluids are used during cutting and grinding.
Finally, verification does not have to look like a metrology lab. ASTM D4543 describes practical checks using a flat surface, a V-block, and a dial or displacement gauge, including procedures for assessing flatness and alignment by traversing the end face and recording readings. Industry equipment designed for this purpose mirrors the same approach, using a V-block and dial or digital gauging to verify straightness, flatness, and end verticality to ASTM D4543.
A Simple, Repeatable Workflow For Rock Core Preparation
This workflow is meant to be practical. The point is to reduce avoidable variability by controlling geometry, end condition, and basic documentation, so results reflect the rock rather than preparation artifacts.
Step 1 – Inspect, Mark, And Plan The Cuts
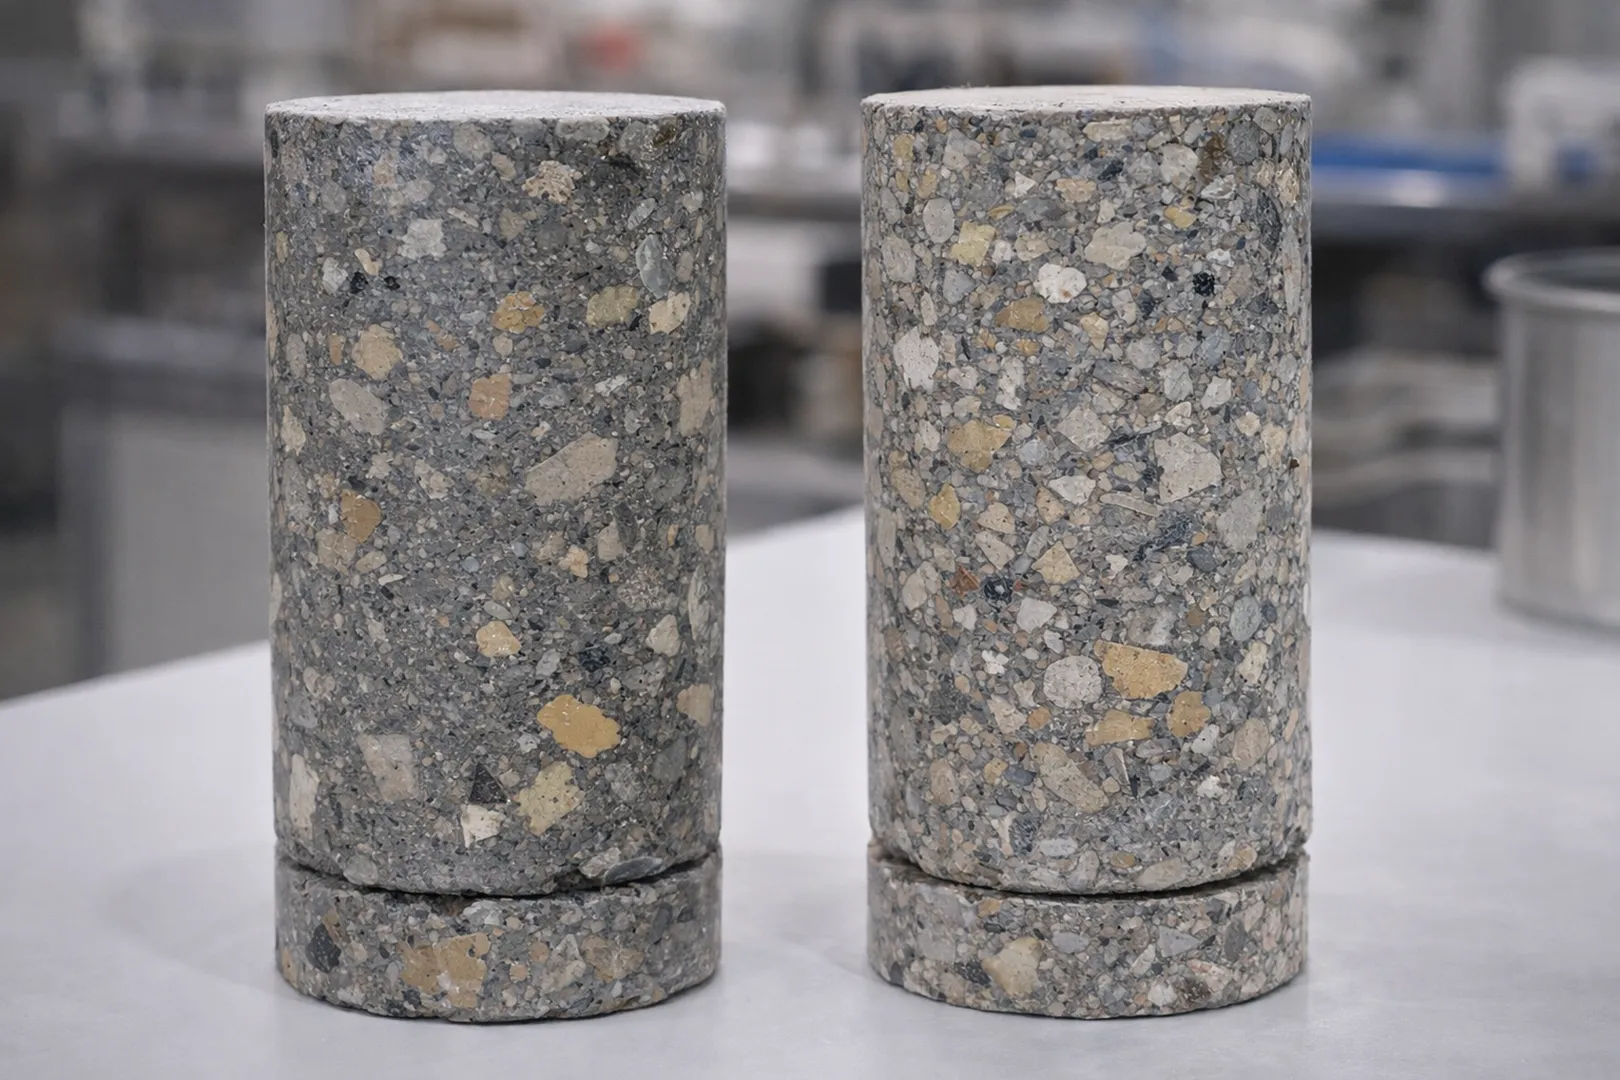
Start by selecting specimens that are representative of the rock type you are trying to characterize. Use a quick visual check to note mineral composition, grain size, and any obvious features that could bias results or require reporting, such as fractures, veins, pores, vugs, or weak planes.
If the rock shows strong fabric (bedding, foliation, cleavage, layering), treat orientation as part of the plan, not an afterthought. Mark the axis and note how loading will be aligned relative to the fabric. This is often the difference between a “clean” dataset and one that quietly mixes different structural directions.
Before cutting, confirm your geometry targets. A test specimen is not just any piece of core. You typically want a straight cylinder, within a standard length-to-diameter range, and large enough that a single grain, clast, or lamination does not dominate the behavior. For coarse or heterogeneous rocks, that usually means choosing a diameter that is many times larger than the largest grains or particles.
What to do in practice:
- Confirm diameter and target L/D range for your test program.
- Identify and record visible defects or features that may disqualify the sample or affect interpretation.
- Mark the specimen axis and planned cut locations for repeatability.
Step 2 – Trim (Cut) To Length
Trimming is the geometry-setting step. The goal is to establish the correct length and produce ends that are “square enough” that grinding becomes a controlled finishing operation, not a major shape correction.
In most labs, wet cutting is the norm because it improves cut quality, controls dust, and helps prevent overheating and edge damage. A stable cut with proper cooling also reduces chipping at the perimeter, which can become a weak initiation point later in the test.
A practical mindset is this: the better the trim, the less material you need to remove during grinding, and the lower the risk of introducing damage through aggressive corrective grinding.
What to do in practice:
- Cut to target length with steady feed and adequate cooling.
- Avoid forcing the blade, especially in brittle or highly fractured rock.
- Aim for ends that are close to square so grinding removes minimal material.
Step 3 – End Grind To Spec
End grinding is where “macro geometry” becomes “contact geometry.” This step is what allows the load to enter the specimen evenly and axially.
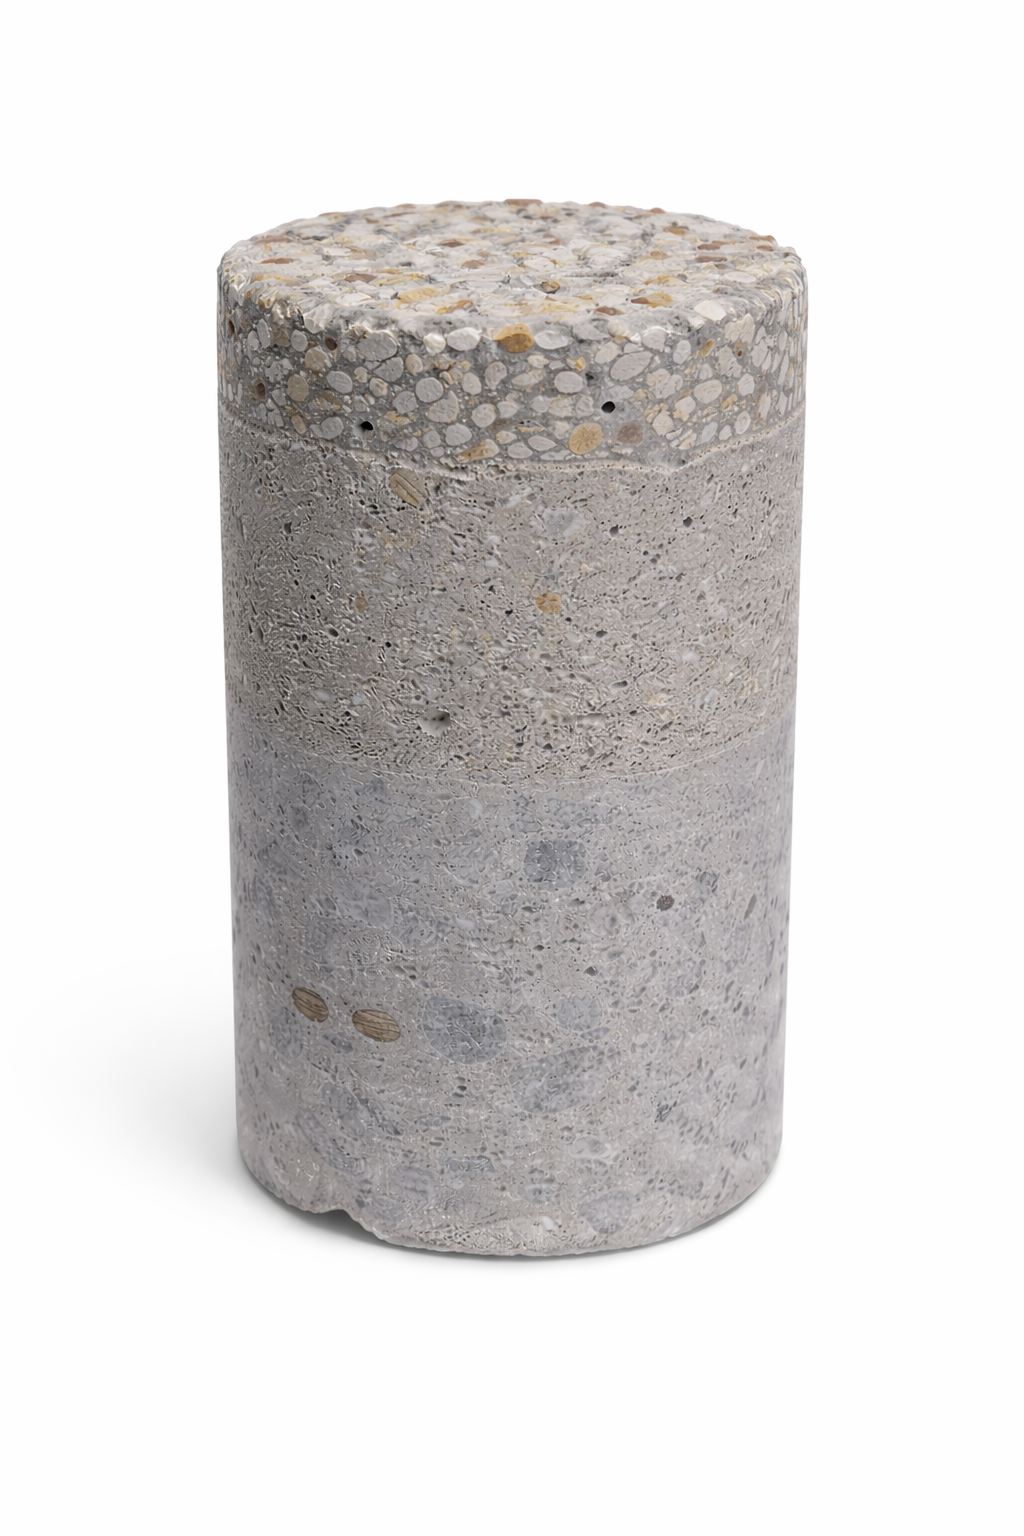
A simple shop-floor completion cue is useful here: grinding is not done when the end “looks okay,” but when the full end face shows consistent grinding coverage, with no untouched high spots. In other words, you are creating a uniform bearing surface.
Keep removal controlled. Heavy, fast material removal increases the risk of chipping, overheating, or microdamage in weaker or porous rocks. Consistent cooling and consistent handling matter because specimen condition, especially moisture state, can influence measured strength and stiffness. If your workflow uses fluids during cutting and grinding, focus on being consistent and storing specimens in a way that avoids unintended drying or saturation changes.
What to do in practice:
- Grind both ends to achieve flatness, parallelism, and perpendicularity.
- Remove material in small, controlled steps rather than forcing correction.
- Use consistent cooling and handling, and store specimens consistently between prep and test.
Step 4 – Verify And Record
Verification is how you separate “real material behavior” from “prep-driven scatter.” You do not need a metrology lab to do this well. Common approaches use a stable flat reference surface, a V-block or similar fixture, and a dial or digital gauge to check straightness and end condition. For perpendicularity, simple squareness checks can be surprisingly effective when done consistently.
Recording what you did is part of quality. At a minimum, document specimen dimensions, any notable defects, moisture condition or handling notes, and orientation relative to bedding or foliation when relevant. This makes outliers diagnosable and helps keep datasets comparable across operators, shifts, and projects.
What to do in practice:
- Verify end condition and straightness using basic fixtures and gauges.
- Record key prep details and achieved checks, not just the final test number.
- Note orientation and conditioning so results remain traceable and defensible.
Common Preparation Mistakes (And What They Do To Your Data)
 These problems show up again and again in real labs because they do not always look dramatic during preparation. They usually show up later as noisy data, inconsistent failure modes, or a “mystery” shift in strength or stiffness.
Angled ends, meaning poor perpendicularity, change the load path. Instead of entering the specimen axially, the load begins on an edge or a biased area, creating localized stress concentrations and early crack initiation. Numerical modeling work shows that even relatively small end-geometry deviations can significantly change the internal stress distribution and the way the specimen fails, including localized damage patterns tied to the defect location and type.
Non-parallel ends are a scatter amplifier. Even if both ends look flat, a small lack of parallelism means the specimen can load unevenly, shifting contact pressure toward one side. In practice, that can look like localized crushing near one end, early cracking, or more test-to-test scatter than the rock type would normally produce. Variability-focused literature also notes that non-parallel loading conditions can create considerable scatter that gets mistaken for inherent material variability.
“Good enough” flatness is a trap. When one end has subtle high spots, the test starts with partial contact rather than full-area bearing. That can bias not only peak strength but also the slope of the stress-strain response, meaning stiffness estimates and related parameters can drift. Recent research continues to support the general principle that shape tolerances influence measured UCS as well as modulus-related outputs.
Over-aggressive grinding can create damage you do not want. Common failure modes include perimeter chipping, localized crushing at asperities, or unintended condition changes if specimens cycle between wet and dry states during preparation. Moisture and conditioning matter because changes during preparation can alter measured strength and deformation behavior.
Finally, operator-to-operator variability is real, even in experienced labs. Small differences in cut squareness, wheel wear, material removal rate, and whether verification happens every time can produce a “who prepared it?” effect in the dataset. At the same time, it is worth being honest: scatter is not only preparation. Some rock-to-rock variability comes from features you may not detect with routine screening, such as subtle microcracking. The takeaway is practical: you cannot eliminate geology, but you can avoid adding preventable preparation noise.
When Automation Makes The Most Sense
Automation makes the most sense when consistency is the priority, not only speed. If your lab tests strong rocks, runs high-stiffness setups, or uses configurations that do not naturally self-align, small end-condition errors can become a dominant driver of scatter. In these cases, consistent trimming, controlled grinding, and routine verification are quality controls, and automation is a direct way to enforce them.
It also becomes compelling when multiple operators or shifts are involved. The steps that create variability are predictable: cut squareness, consistency of material removal, consumable wear, and whether checks are performed and documented every time. A standardized process reduces dependence on individual technique and makes training simpler, because the workflow is built into the operation rather than living in one person’s habits.
Finally, automation is especially valuable when you need traceability. Being able to repeat the same preparation settings across batches, and to show what was done and when, helps labs defend results, troubleshoot outliers, and keep multi-project datasets comparable over time.
NextGen Rock Core Preparation Systems
The goal of the workflow you just read is consistency: control macro geometry first, then control end-surface geometry, then verify. This is exactly how our two preparation systems are intended to be used together, as a practical way to reduce prep-driven scatter and make results easier to reproduce across batches and operators.
CoreTrim 3000 – Repeatable Trimming Before Grinding
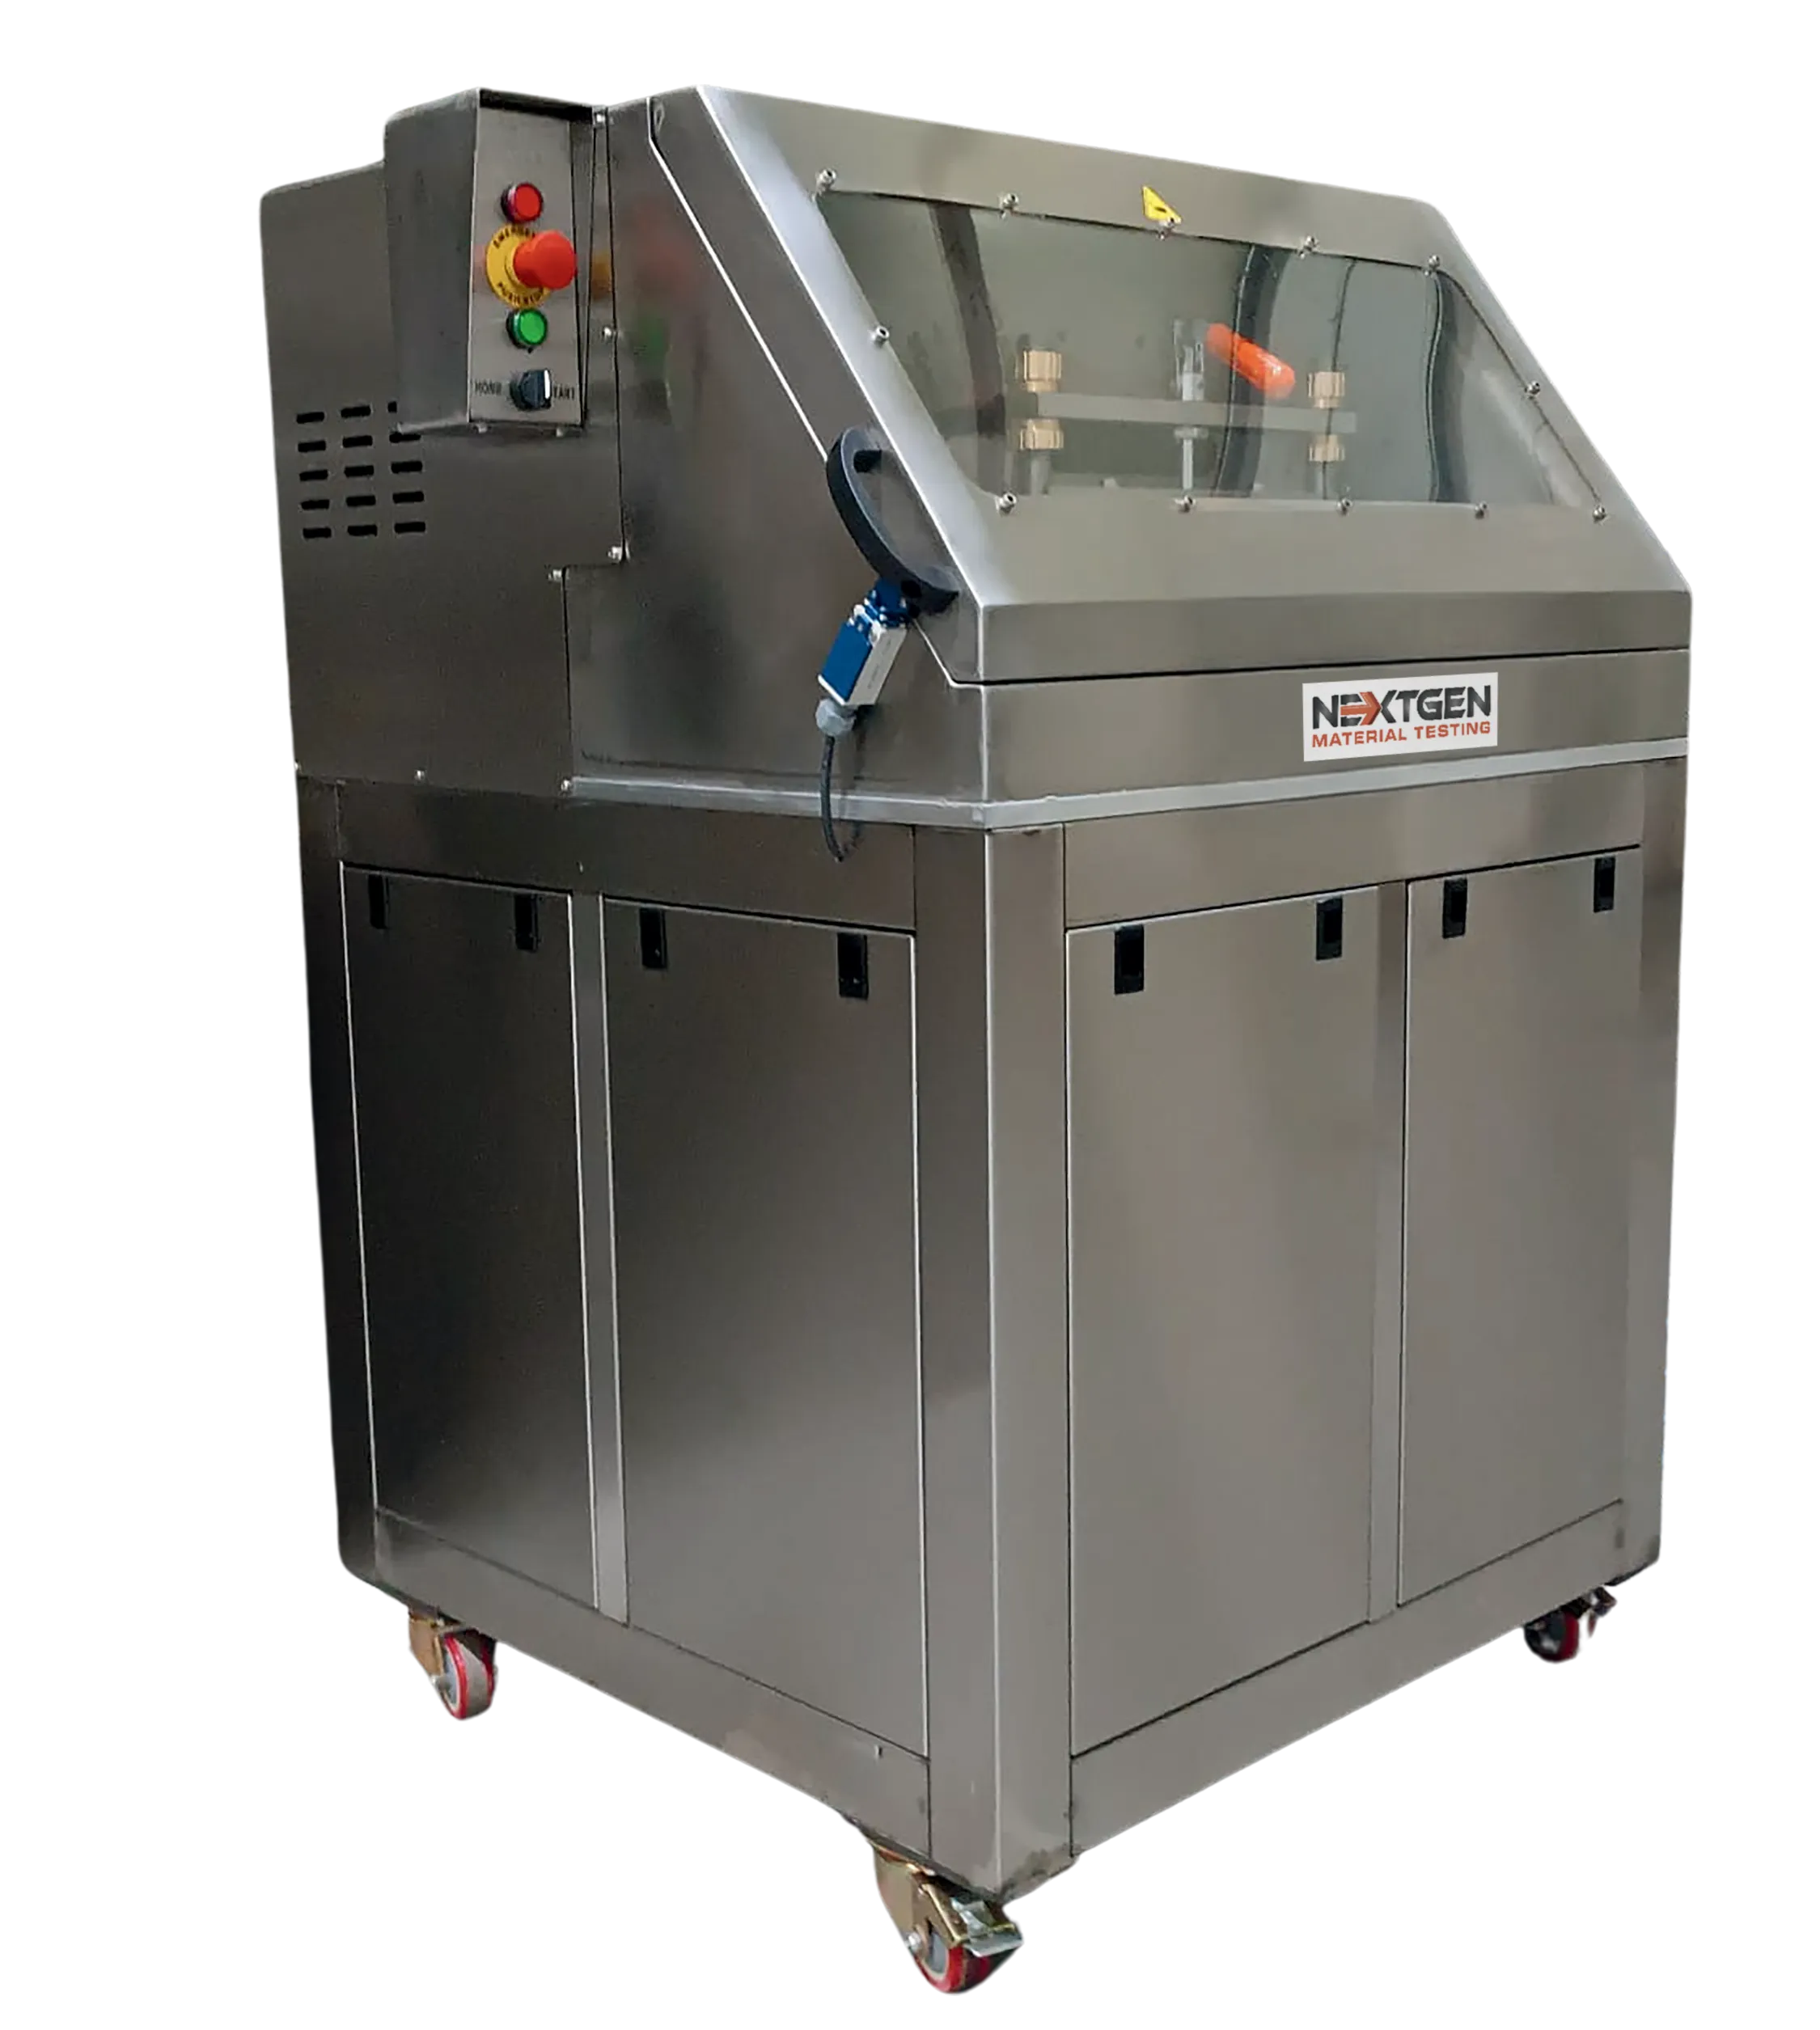 CoreTrim 3000 is a fully automatic core cutting system designed for sample preparation. In practical terms, it acts as the macro-geometry gatekeeper. If you consistently hit your length targets and keep ends square enough at the cutting stage, your grinder can do controlled finishing instead of heavy correction. That helps protect throughput and reduces the risk of edge damage from aggressive downstream removal.
Key capability points to include:
- Core diameter range: 38 to 100 mm
- Capacity: up to 3 samples per cycle
- Cutting angle accuracy: up to 0.1 degrees
- Cycle time: about 120 seconds per cycle for 3 samples
- Automatic water spray for dust control
CoreGrind 3000 – Controlled End Grinding With Recipe-Based Repeatability
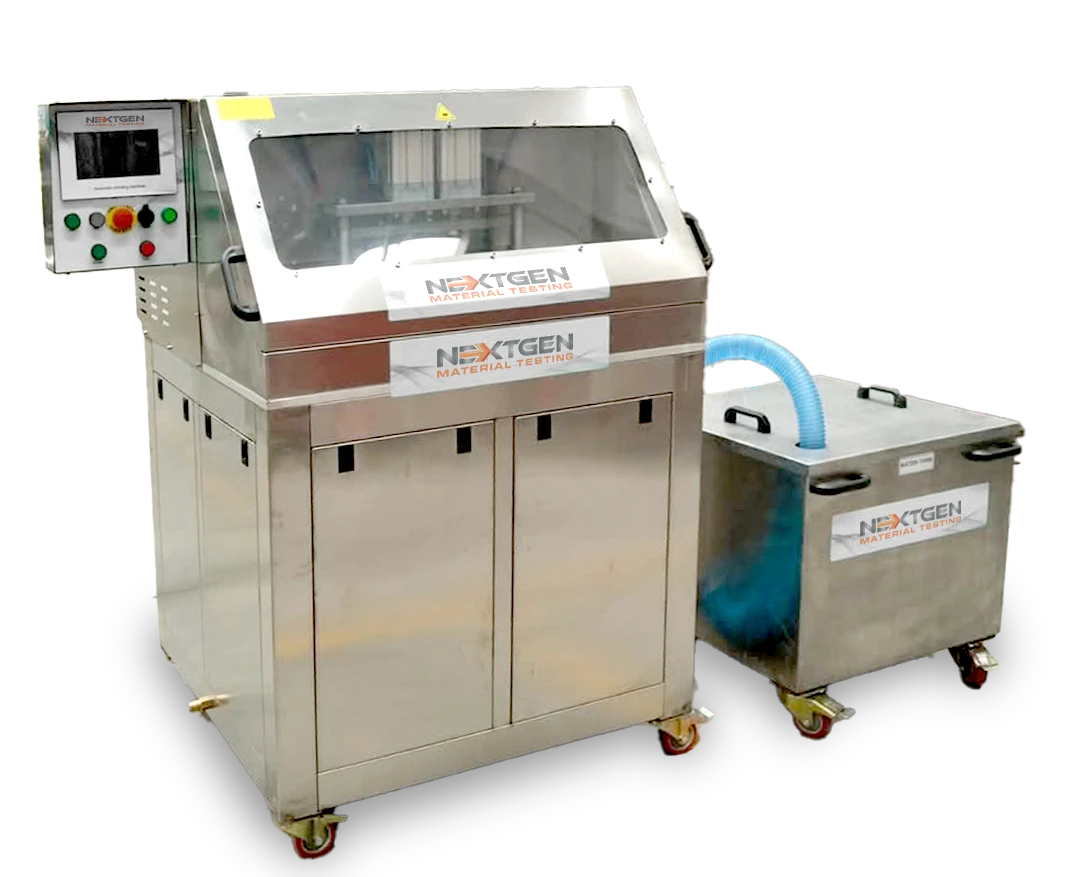 CoreGrind 3000 is a fully automatic rock core grinding machine built for consistent end preparation. It is designed around repeatable operation, using a 7-inch touchscreen interface with recipe-based workflows and pneumatic sample locking. In other words, you can standardize how material is removed and how each batch is finished, which is one of the fastest ways to reduce operator-to-operator variability.
It is available in two versions:
- V1: 38 to 100 mm core diameters
- V2: 50 to 160 mm core diameters
Process-control and QA-friendly features to highlight:
- Adjustable grinding step control: 0.5 to 1.5 mm
- Process memory and data recording for traceability
- Diamond grinding blade life monitoring
- Recirculating water spray for dust control
- Optional surface flatness control specified at 0.01 degrees, viewable on the touchscreen when installed
Consistency Starts Before The Test
Rock core testing provides intact rock parameters engineers rely on to inform excavation strategy, stability checks, and deformation expectations in projects like mining, tunneling, and dams. These lab programs typically report compressive strength in uniaxial or triaxial compression and, when stress strain data are captured, stiffness values such as Young’s modulus and Poisson’s ratio.
At the same time, intact core results are not the same as in situ rock mass behavior. Joints, weakness planes, and heterogeneity strongly influence real structures, which means engineering judgment is always needed when applying lab values. That is exactly why preparation matters. Trimming and end grinding are two steps that often decide whether your data are clean or noisy. When end conditions are even slightly off, contact becomes uneven, loading becomes non-axial, and scatter can grow fast, sometimes changing failure behavior as well as the numbers.
The practical takeaway is simple: control macro geometry first, then control end-surface geometry, and verify what you achieved. A repeatable workflow, consistent handling, and routine checks make your results more comparable across operators and batches, and make outliers easier to diagnose instead of guess at.
The right configuration typically depends on your core diameter range, sample volume, target preparation tolerances, staffing (single operator vs multiple shifts), and how much traceability you need for QA and reporting.
If you are preparing rock core specimens and want to improve repeatability, increase throughput, or tighten end-condition control, contact NextGen to discuss your application. Share your core diameter range, expected samples per day or week, and the tests you run, and we will recommend the most suitable configuration. You can request a quote or ask for guidance on the best setup for your lab through our website.